Global conventional exploration farm-in/farm-out activity has reduced by around two thirds from 2012 to 2017, in line with the reduction in overall drilling activity. As activity levels have fallen, so have deal terms and costs.
The average level of promote (i.e. the proportion above their equity interest that companies are willing to pay to access a drilling opportunity) offshore has decreased from >2.0 in 2012/2013 to 1.5 in 2016/2017, whilst the average farm-in cost per percentage of equity – compounded by lower well costs – has reduced by roughly 70% over the same period.
Although overall farm-in activity levels remain subdued, the number of deep water deals has picked up recently and the 13 deep water deals completed so far in 2018 have had an average level of promote of 2.2.
Since the start of 2012, and outside of North America, the most active farm-in company has been Total (25 recorded farm-ins), whilst the most active farm-out company has been Tullow (16 recorded farm-outs). Companies that have discovered the largest net volume from wells drilled since the start of 2012 on farm-outs have been BP, Hess and CNOOC. Unsurprisingly, these companies also registered the lowest net farm-in finding costs – at well below US$1/boe.
Compared to the overall industry exploration performance, however, average farm-in commercial success rates and finding costs have been poor, albeit performance has improved in recent years on the back of high-profile farm-in discoveries offshore Guyana and Senegal.
Higher oil prices, cheaper deal terms, improved success rates and recent large farm-in discoveries are all positives for supporting a recovery in activity levels within the exploration farm-out market. It remains to be seen how strong this recovery will be and to what extent the cost of farming-in may also start to rebound. With a median duration of ~330 days between an opportunity coming to market and a deal being completed, and then a further ~250 days before an exploration well is drilled, the quality of today’s farm-in opportunity set will not become fully apparent for at least another two years.
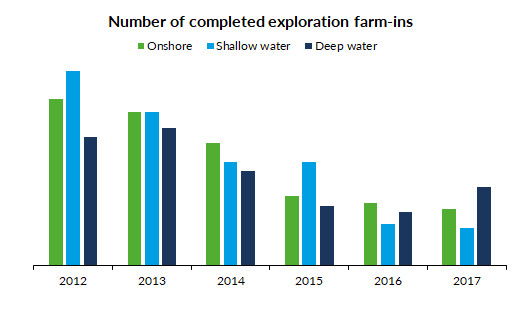 Figure 1: Number of completed exploration farm-in deals by year, 2012-2017, and by location. Deep water is >500m.
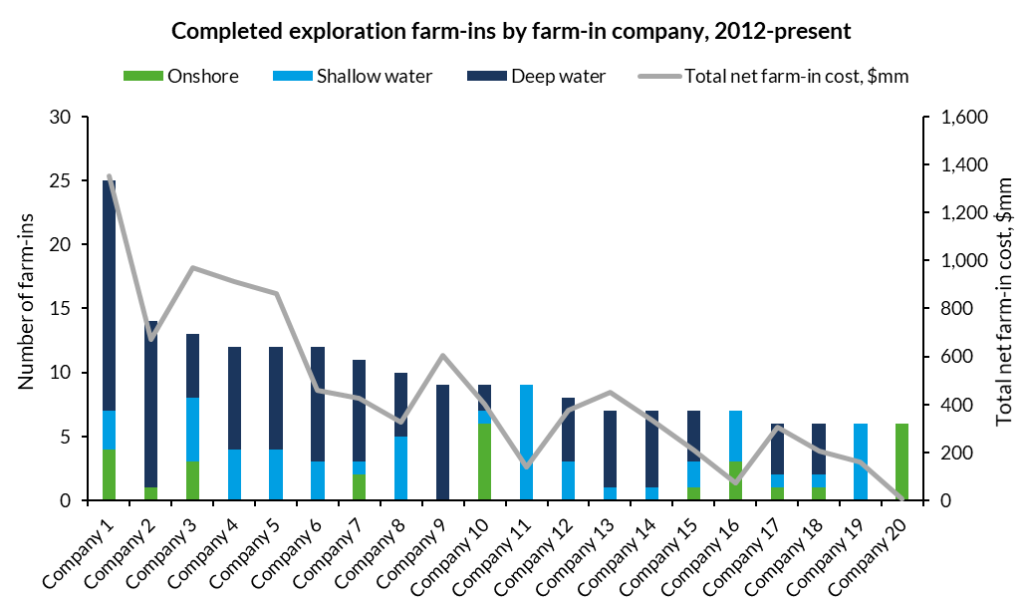 Figure 2: The 20 most active farm-in companies based on completed farm-in deals since the start of 2012, split by location, and their estimated total net farm-in cost. Deep water is >500m.
This is an extract from a recently published report on Westwood’s Wildcat service: ‘The Dynamics of the Modern Farm-Out Market’. The analysis presented within the report is, in turn, based on a newly launched ‘Farm-Out Analytics’ tool within Wildcat, allowing analysis and benchmarking of over 2,300 completed exploration farm-in deals.
To arrange a demonstration of the Wildcat service or to purchase the individual report, please visit Westwood Global Energy Group at https://www.westwoodenergy.com/research/wildcat or contact
Rhona McFarlane
[email protected] or +44 (0)20 3794 5381