What Does Increasing HHP Demand Mean for Pumpers?
The back half of 2018 witnessed more than a 4% decline in active horsepower (HHP) being removed from the field, driven by HHP oversupply, budget exhaustion, takeaway constraints, in addition to typical seasonal and weather impacts. However, Westwood forecasts a steadier 2019 demand scenario, resulting in potential market tightness at year’s end.
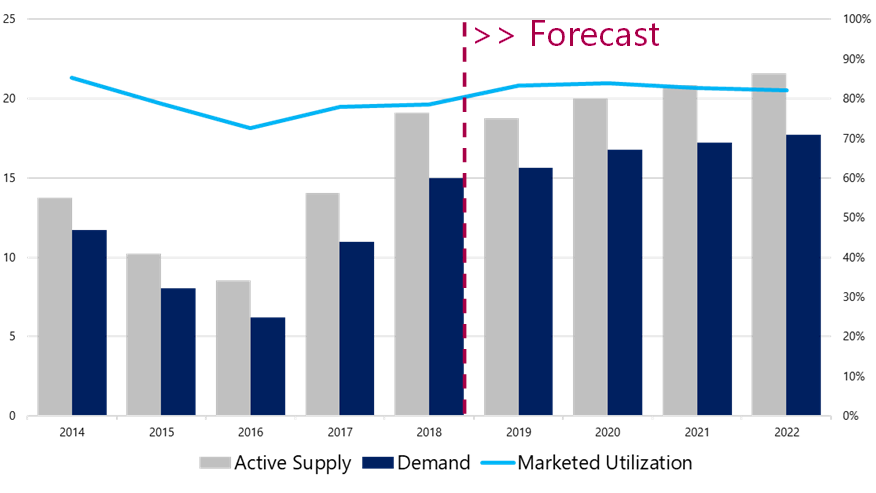
Figure 1: Historic HHP and crew counts from Q1’14-Q4-18. Forecasted HHP begins Q1’19 and ends Q4’22. Analysis assumes a $60 WTI in 2019, increasing as high as $67 from 2020-2022. Source: Westwood, company reports
Compared to Q4’18, Westwood estimates just over 200,000 HHP has been removed from active status during Q1’19 across the seven key US basins covered in this report – the Permian, DJ-Niobrara, Eagle Ford, Haynesville, MidCon, Williston, and Appalachia. This reduction is largely driven by the Permian Basin of West Texas and Southeastern New Mexico, which saw a 5% decline in active HHP during Q1’19.
However, the alleviation of the Permian bottleneck during H2’19 and the subsequent work down of the growing DUC backlog, will result in a boost in demand during Q4’19 in West Texas. Looking at the US, HHP demand is expected to increase during Q2’19. The result could indicate a tightening frac market moving in 2020, especially in the Permian.
The report illustrates a basin level supply/demand scenario—both historic and forecast—portraying total HHP capacity, active supply, HHP demand and marketed utilization. The report also includes a historic picture of crew counts, as well as leading financial indicators for market leading pressure pumpers. Additionally, the provided HHP data will display total HHP capacity, active HHP, total crews and active crews on a pumper and basin level view.