
BP followed up the release of its Energy Outlook with a ‘BP Week’ of strategy presentations intended to flesh out its ‘Net Zero in 2050’ ambitions announced in February this year, by the new CEO Bernard Looney. A key ambition is to be ‘net zero on an absolute basis across the carbon content of our upstream oil and gas production by 2050 or sooner.’ This makes BP one of the most radical IOCs when it comes to adapting its business to the Energy Transition. Investors have been waiting for the detailed plans behind the ambition, so what did BP reveal last week about how its E&P business that produced 3.8 million boe/d in 2019 plans to achieve net zero emissions from the production and consumption of the hydrocarbons it produces?
BP’s Oil and Gas Demand Scenarios
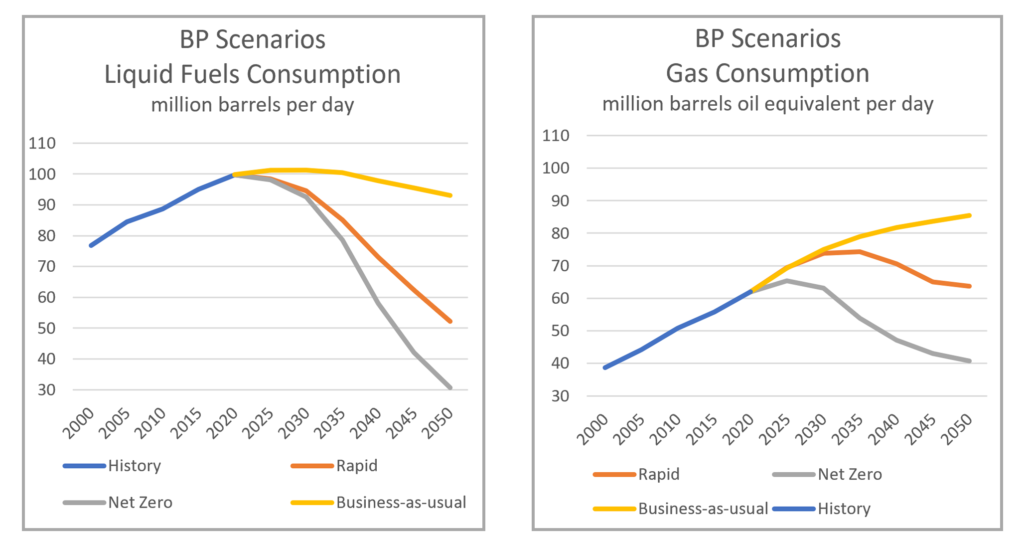
According to BP’s 2020 Energy Outlook report, the ‘Net zero’ scenario is consistent with 1.5oC of warming and ‘Rapid’ is consistent with less than 2oC of warming. ‘Busines as usual’ assumes the continuation of current policies.
BP World Energy Outlook 2020 data pack and Westwood analysis
Under the Rapid and Net Zero scenarios, liquids consumption has already peaked and will fall from 100 million bbl/d in 2018 to 52 and 31 million bbl/d in 2050 respectively. Gas consumption in the ‘Rapid scenario’, on the other hand, grows until 2035 before falling back to 2020 consumption levels in 2050. In the Net Zero scenario, gas consumption falls by a third by 2050.
BP’s upstream production guidance to 2030
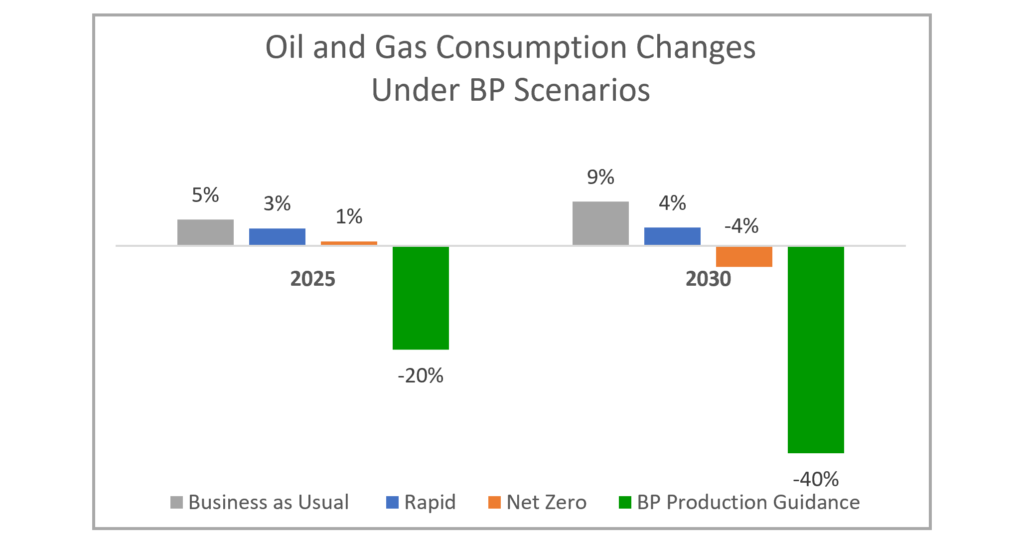
BP’s guidance for its equity production is that it will fall by c. 40%, from 2.6 mmboe/d to 1.5 mmboe/d in 2030. It plans to sell 600 mboe/d of production by 2025 of which 200 mboe/d is in deals which have been agreed already. BP’s 19.75% stake in Rosneft contributes 1.1 mmboe/d and is not included in the targets above. Rosneft looks increasingly peripheral to BP’s central aim of achieving carbon neutrality and becoming an International Energy Company, rather than an IOC.
The chart below shows that BP’s planned cuts to its oil and gas production are far greater than the implied fall in global demand in its own scenarios even under a world on track for 1.5 oC of warming.
BP World Energy Outlook 2020 data pack and Westwood analysis
Implications for the E&P business
The scale and speed of the transition BP is undertaking is without precedent. Ignoring Rosneft, the cut in production from 2.6 to 1.5 mmboe/d means that BP will be producing 400 million fewer barrels of oil equivalent per year in 2030. BP indicated that it would ‘manage the R/P ratio down to 8 years’. R/P ratio was around 11 years at end 2019.
BP has indicated that it will cut E&P capex from ~$12bn in 2019 to ~$8bn in the 2021-2025 period. Oil projects will need a payback period of <10 years and gas projects <15 years to be sanctioned. Average point forward development costs are estimated at $9/boe.
BP would produce 8 billion barrels of oil equivalent over the next ten years, excluding Rosneft, assuming a linear decrease in production to the 1.5 mmboe/d target in 2030. This compares to reported net proved developed reserves at end 2019 of 6 bnboe. An R/P ratio of 8 in 2030 with production of 1.5 mmboe/d would imply proved reserves of 4.4 bnboe. BP stated it had 16 bnboe of ‘resources’ in the strategy presentation, therefore, in theory only 6 bnboe of this resource would be need to be moved to reserves over the next 10 years. BP therefore has currently more than enough discovered resource to replace reserves without exploration
Exploration spending will be cut to $350-400 million per annum with a focus on new hubs in existing areas. The strategy appears to be to maintain a hopper of 400 million boe risked volume net to BP. Examples of near-term drilling that fit this description include the Ironbark gas prospect on the NW Shelf of Australia, the Shafag Asimam gas prospect in Azerbaijan and Galapagos Deep frontier oil prospect in the Gulf of Mexico which have been on BP’s books for many years. There will be no new country entries and presumably also exits from acreage that no longer fits the strategy. In 2019 BP reported spend of $1.3bn of E&A ($800m exploration only) and said exploration and acreage access capital peaked at $4.6bn in 2010. This a significant chunk taken out of the global exploration budget and marks the end of BP as a major player in exploration.
Investor reaction?
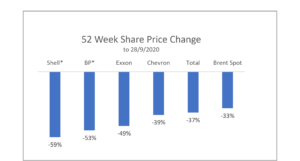
BP’s share price has fallen by 53% in the last 12 months and is second worst only to Shell of the five Supermajors. ESG investors may be celebrating the pivot in strategy but the wider investor community has not yet rewarded BP for its efforts. So far, the cuts to dividends announced by BP and Shell have seemingly outweighed ESG considerations in the minds of investors.
There are sceptics who wonder whether the sums add up. BP intends to cut production at a faster rate than its own scenarios suggest is necessary to align with the Paris Agreement and achieve <2oC of warming. Also, the 600 mboe/d that it plans to divest by 2025 will not contribute to the Paris goals, as the barrels will still be produced by someone else. BP’s production contributed about $12/boe of net income in 2019 at average Brent prices of $64/bbl. With the change in strategy, it will be producing 400 million fewer barrels in 2030 and so it will need to replenish $4.8bn of annual net income from alternative sources to make up for the foregone production. Asset sales should compensate in the short term, but it is still a lot of profit to find to sustain a business of BP’s current scale.
The aims are laudable, and the presentations are compelling, but will the strategy pay off for shareholders, or is BP moving too quickly in its transition from IOC to IEC? Time will tell.
BP World Energy Outlook 2020 data pack and Westwood analysis
Keith Myers, President, Research
[email protected]