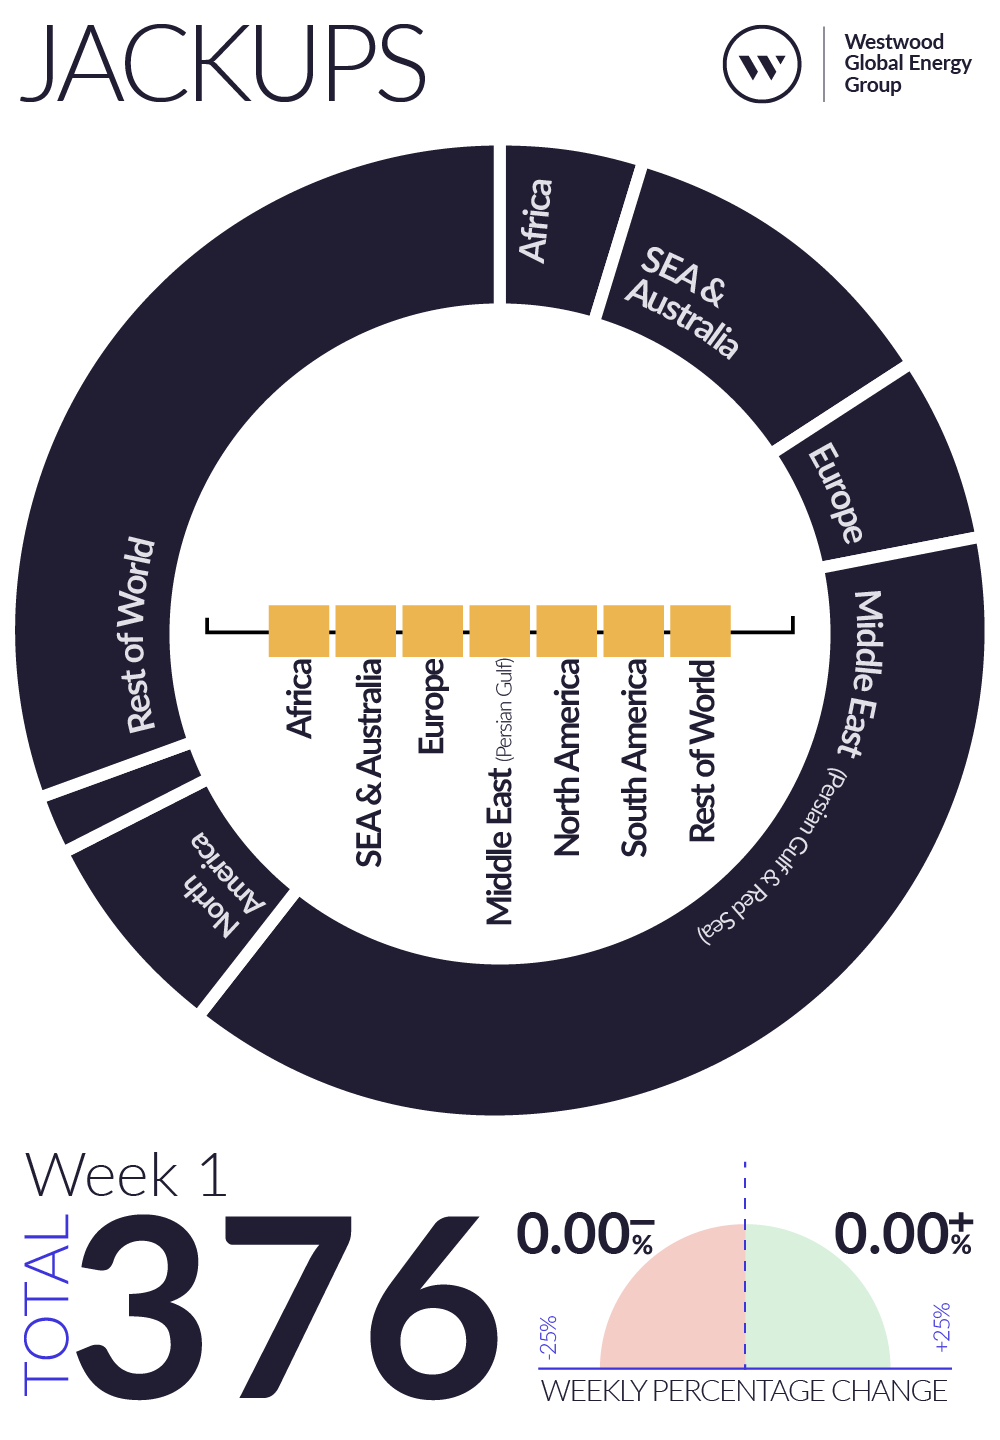
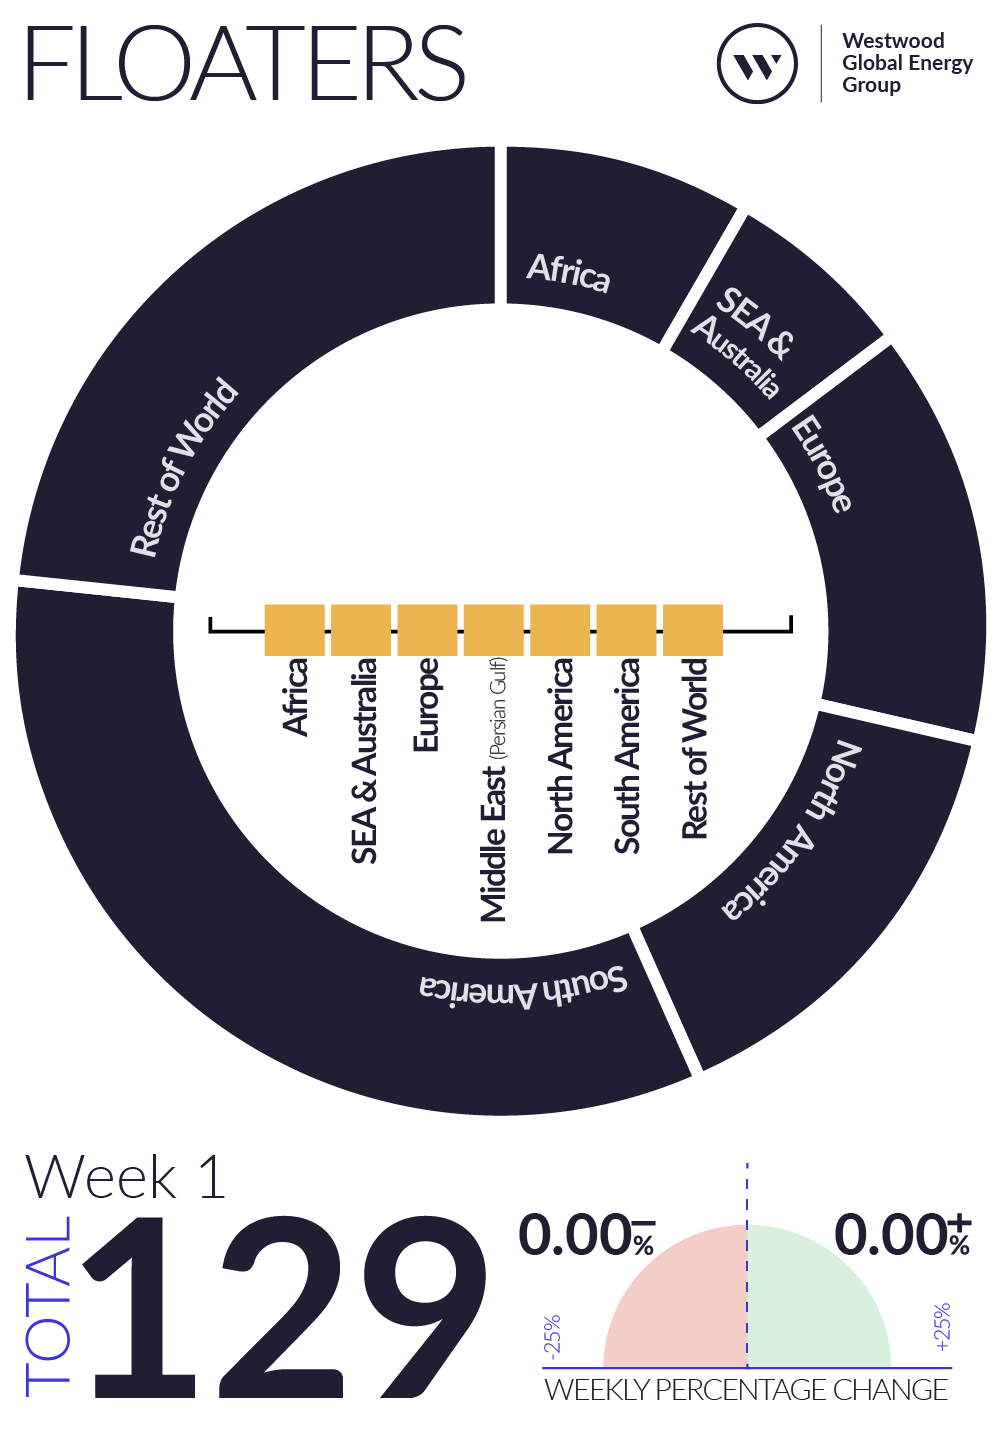
Weekly offshore rig count totals for jackup and floating drilling rigs across the key global regions, with data provided by RigLogix.

Rig counts from other years;

Global Rig Count As of DateGlobal Jackup Rig Count TotalGlobal Floating Rig Count Total
Monday 2nd December 2024393141

The global offshore rig count for jackup and floating rigs for week 49 as of Monday 2nd December, 2024

Weekly Global Offshore Rig Count, Jackups, Week 49 2024
Weekly Global Offshore Rig Count, Floaters, Week 49 2024
Global Rig Count As of DateGlobal Jackup Rig Count TotalGlobal Floating Rig Count Total
Monday 4th November 2024393144
Monday 11th November 2024391145
Monday 18th November 2024392142
Monday 25th November 2024394141

The global offshore rig count for jackup and floating rigs for week 48 as of Monday 25th November, 2024

Weekly Global Offshore Rig Count, Jackups, Week 48 2024
Weekly Global Offshore Rig Count, Floaters, Week 48 2024

The global offshore rig count for jackup and floating rigs for week 47 as of Monday 18th November, 2024

Weekly Global Offshore Rig Count, Jackups, Week 47 2024
Weekly Global Offshore Rig Count, Floaters, Week 46 2024

The global offshore rig count for jackup and floating rigs for week 46 as of Monday 11th November, 2024

Weekly Global Offshore Rig Count, Jackups, Week 46 2024
Weekly Global Offshore Rig Count, Floaters, Week 46 2024

The global offshore rig count for jackup and floating rigs for week 45 as of Monday 4th November, 2024

Weekly Global Offshore Rig Count, Jackups, Week 45 2024
Weekly Global Offshore Rig Count, Floaters, Week 45 2024

October closed the month at 393 jackups classed as active, which was unchanged when compared with the end of September. The number of active rigs in the Middle East reduced by two month-on-month and the North Sea count fell by one unit, however increases were witnessed in other areas of the world including Africa. Meanwhile, the floating rig segment (drillships and semisubmersibles) ended October at 143 active assets, which was a four-rig increase in active units compared with the end of September. This was due to a three-rig increase in South America, as well as a three-rig uptick in other areas of the world, however, decreases were recorded during the month in North America, and the North Sea.

Global Rig Count As of DateGlobal Jackup Rig Count TotalGlobal Floating Rig Count Total
Monday 7th October 2024395144
Monday 14th October 2024394145
Monday 21st October 2024393143
Monday 28th October 2024393143

The global offshore rig count for jackup and floating rigs for week 44 as of Monday 28th October, 2024

Weekly Global Offshore Rig Count, Jackups, Week 44 2024
Weekly Global Offshore Rig Count, Floaters, Week 44 2024

The global offshore rig count for jackup and floating rigs for week 43 as of Monday 21st October, 2024

Weekly Global Offshore Rig Count, Jackups, Week 43 2024
Weekly Global Offshore Rig Count, Floaters, Week 43 2024

The global offshore rig count for jackup and floating rigs for week 42 as of Monday 14th October, 2024

Weekly Global Offshore Rig Count, Jackups, Week 42 2024
Weekly Global Offshore Rig Count, Floaters, Week 42 2024

The global offshore rig count for jackup and floating rigs for week 41 as of Monday 7th October, 2024

Weekly Global Offshore Rig Count, Jackups, Week 41 2024
Weekly Global Offshore Rig Count, Floaters, Week 41 2024

September closed the month at 393 jackups classed as active, which is a two-rig increase versus the end of August. This is due to some rigs that had been suspended in Saudi Arabia finding and starting new jobs in Asia Pacific and South America. Meanwhile, the floating rig segment (drillships and semisubmersibles) ended September at just 139 active assets, which was a six-rig decrease in active units during the same period, as Southeast Asia dipped by three rigs, North Sea by one rig, and South America and North America each had a reduced rig count of each.

Global Rig Count As of DateGlobal Jackup Rig Count TotalGlobal Floating Rig Count Total
Monday 2nd September 2024388145
Monday 9th September 2024391144
Monday 16th September 2024391142
Monday 23rd September393139
Monday 30th September395141

The global offshore rig count for jackup and floating rigs for week 40 as of Monday 30th September, 2024

Weekly Global Offshore Rig Count, Jackups, Week 40 2024
Weekly Global Offshore Rig Count, Floaters, Week 40 2024

The global offshore rig count for jackup and floating rigs for week 39 as of Monday 23rd September, 2024

Weekly Global Offshore Rig Count, Jackups, Week 39 2024
Weekly Global Offshore Rig Count, Floaters, Week 39 2024

The global offshore rig count for jackup and floating rigs for week 38 as of Monday 16th September, 2024

Weekly Global Offshore Rig Count, Jackups, Week 38 2024
Weekly Global Offshore Rig Count, Floaters, Week 38 2024

The global offshore rig count for jackup and floating rigs for week 37 as of Monday 9th September, 2024

Weekly Global Offshore Rig Count, Jackups, Week 36 2024
Weekly Global Offshore Rig Count, Floaters, Week 36 2024

The global offshore rig count for jackup and floating rigs for week 36 as of Monday 2nd September, 2024

Weekly Global Offshore Rig Count, Jackups, Week 36 2024
Weekly Global Offshore Rig Count, Floaters, Week 36 2024

August closed the month at 391 jackups classed as active, which was a two-rig increase versus the end of July. This is attributed to higher global activity in Africa despite a slip in South American demand in the same period. Meanwhile, the floating rig segment (drillships and semisubmersibles) ended August at just 145 active assets, which was a two-rig decrease in active units versus the same point in July, due to lower activity in the North Sea and Africa.

Global Rig Count As of DateGlobal Jackup Rig Count TotalGlobal Floating Rig Count Total
Monday 5th August 2024383147
Monday 12th August 2024383147
Monday 19th August 2024391147
Monday 26th August 2024391145
Weekly Global Offshore Rig Count, Jackups, Week 35 2024
Weekly Global Offshore Rig Count, Floaters, Week 35 2024

The global offshore rig count for jackup and floating rigs for week 34 as of Monday 19th August, 2024

Weekly Global Offshore Rig Count, Jackups, Week 34 2024
Weekly Global Offshore Rig Count, Floaters, Week 34 2024

The global offshore rig count for jackup and floating rigs for week 33 as of Monday 12th August, 2024

Weekly Global Offshore Rig Count, Jackups, Week 33 2024
Weekly Global Offshore Rig Count, Floaters, Week 33 2024

The global offshore rig count for jackup and floating rigs for week 32 as of Monday 5th August, 2024

Weekly Global Offshore Rig Count, Jackups, Week 32 2024
Weekly Global Offshore Rig Count, Floaters, Week 32 2024

July closed the month at 389 jackups classed as active, which was a one-rig decrease versus the end of June. This is attributed to a five-rig decrease in Southeast Asia but a growth in other areas of four units.  Meanwhile, the floating rig segment (drillships and semisubmersibles) ended July at just 147 active assets, which was a three-rig decrease in active units versus the same point in June, due to a drop in active rigs in North America.

Global Rig Count As of DateGlobal Jackup Rig Count TotalGlobal Floating Rig Count Total
Monday 1st July 2024391148
Monday 8th July 2024391148
Monday 15th July 2024391146
Monday 22nd July 2024390146
Monday 29th July 2024389147

The global offshore rig count for jackup and floating rigs for week 31 as of Monday 29th July, 2024

Weekly Global Offshore Rig Count, Jackups, Week 31 2024
Weekly Global Offshore Rig Count, Floaters, Week 31 2024

The global offshore rig count for jackup and floating rigs for week 30 as of Monday 22nd July, 2024

Weekly Global Offshore Rig Count, Jackups, Week 30 2024
Weekly Global Offshore Rig Count, Floaters, Week 30 2024

The global offshore rig count for jackup and floating rigs for week 29 as of Monday 15th July, 2024

Weekly Global Offshore Rig Count, Jackups, Week 29 2024
Weekly Global Offshore Rig Count, Floaters, Week 29 2024

The global offshore rig count for jackup and floating rigs for week 28 as of Monday 8th July, 2024

Weekly Global Offshore Rig Count, Jackups, Week 28 2024
Weekly Global Offshore Rig Count, Floaters, Week 28 2024

The global offshore rig count for jackup and floating rigs for week 27 as of Monday 1st July, 2024

Weekly Global Offshore Rig Count, Jackups, Week 27 2024
Weekly Global Offshore Rig Count, Floaters, Week 27 2024

June closed the month with 391 jackups active, which is a further decline of three units versus the end of May 2024 as further Saudi Aramco contracted units begun their suspension periods. This has now resulted in the Middle East having just 158 jackups working, which is the lowest figure recorded since November 2022. However, Asia Pacific has recorded a five-rig increase in active rigs since the beginning of the year. The floating rig market remained flat at 148 active units at the end of June versus the end of May 2024. North America, South America and Asia all recorded one-rig decreases during the period.

Global Rig Count As of DateGlobal Jackup Rig Count TotalGlobal Floating Rig Count Total
Monday 3rd June 2024393149
Monday 10th June 2024391147
Monday 17th June 2024391149
Monday 24th June390150

The global offshore rig count for jackup and floating rigs for week 26 as of Monday 24th June, 2024

Weekly Global Offshore Rig Count, Jackups, Week 26 2024
Weekly Global Offshore Rig Count, Floaters, Week 26 2024

The global offshore rig count for jackup and floating rigs for week 25 as of Monday 17th June, 2024

Weekly Global Offshore Rig Count, Jackups, Week 25 2024
Weekly Global Offshore Rig Count, Floaters, Week 25 2024

The global offshore rig count for jackup and floating rigs for week 24 as of Monday 10th June, 2024

Week 24 2024 Jackups
Week 24 2024 Floaters

The global offshore rig count for jackup and floating rigs for week 23 as of Monday 3rd June, 2024

Week 23 2024 Jackups
Week 23 2024 Floaters

The month of May closed with just 394 jackups active – the lowest figure since February 2023 and a 6.25% decrease versus the end of the previous month. Once again, this drop is attributed to further jackups being suspended by Saudi Aramco in the Middle East which will ultimately result in at least 22 units being idled for up to one year. The other regions, however, remained unchanged versus the prior period and holding steady. Furthermore, three jackups currently suspended by the national oil company have since been confirmed for redeployment to other areas of the world later this year. Meanwhile, the floating rig market closed the month of May with 151 units active, which is a two-rig increase versus the end of March. This is attributed to a one-rig increase in North America, South America and Asia, but a one-unit decline in Africa.

Global Rig Count As of DateGlobal Jackup Rig Count TotalGlobal Floating Rig Count Total
Monday 6th May 2024400147
Monday 13th May 2024395145
Monday 20th May 2024397147
Monday 7th May394148

The global offshore rig count for jackup and floating rigs for week 22 as of Monday 27th May, 2024

Week 22 2024 Jackups
Week 22 2024 Floaters

The global offshore rig count for jackup and floating rigs for week 21 as of Monday 20th May, 2024

Week 21 2024 Jackups
Week 21 2024 Floaters

The global offshore rig count for jackup and floating rigs for week 20 as of Monday 13th May, 2024

Week 20 2024 Jackups
Week 20 2024 Floaters

The global offshore rig count for jackup and floating rigs for week 19 as of Monday 6th May, 2024

Week 19 2024 Jackups
Week 19 2024 Floaters

April closed the month at 405 jackups classed as active, which is a five-rig decrease versus the end of March. This is mainly attributed to a sharp drop in rigs on hire in Saudi Arabia, following the start of suspensions by the national oil company which will result in at least 22 units being idled for up to one year. However, during the same period Asia and South America both witnessed small increases in active units. Meanwhile, in the floating rig segment (drillships and semisubmersibles) there was also a two-rig decrease in active units during the same period, as Asia and Africa both witnessed rigs rolling off hire, though North America witnessed a two-rig increase in the period.

Global Rig Count As of DateGlobal Jackup Rig Count TotalGlobal Floating Rig Count Total
Monday 1st April406149
Monday 8th April406149
Monday 15th April408151
Monday 22nd April408150
Monday 29th April405151

The global offshore rig count for jackup and floating rigs for week 18 as of Monday 29th April, 2024

Week 18 2024 Jackups
Week 18 2024 Floaters

The global offshore rig count for jackup and floating rigs for week 17 as of Monday 22nd April, 2024

Week 17 2024 Jackups
Week 17 2024 Floaters

The global offshore rig count for jackup and floating rigs for week 16 as of Monday 15th April, 2024

Week 16 2024 Jackups
Week 16 2024 Floaters

The global offshore rig count for jackup and floating rigs for week 15 as of Monday 8th April, 2024

Week 15 2024 Jackups
Week 15 2024 Floaters

The global offshore rig count for jackup and floating rigs for week 14 as of Monday 1st April, 2024

Week 14 2024 Jackups
Week 14 2024 Floaters

The global jackup count closed off March at 406 units, which was a four-rig decline compared with February 2024. Among the major areas tracked, Africa and the North Sea each recorded a one-rig decline while other areas of the world contributed a further three-rig decrease, while South America demand increased by one during the same period. For floating rigs, the count at the end of March was unchanged when compared with February 2024. Outstanding floater demand remains strong, with 66 tenders, pre-tenders or direct negotiations still to be awarded equating to a ~99 years of work. The majority of this is coming from Brazil and West Africa, which is providing 45% of these demand days.

Global Rig Count As of DateGlobal Jackup Rig Count TotalGlobal Floating Rig Count Total
Monday 4th March409149
Monday 11th March409153
Monday 18th March404154
Monday 25th March410149

The global offshore rig count for jackup and floating rigs for week 13 as of Monday 25th March, 2024

Week 13 2024 Jackups
Week 13 2024 Floaters

The global offshore rig count for jackup and floating rigs for week 12 as of Monday 18th March, 2024

Week 12 2023 Jackups
Week 12 2023 Floaters

The global offshore rig count for jackup and floating rigs for week 11 as of Monday 11th March, 2024

Week 11 2024 Jackups
Week 11 2024 Floaters

The global offshore rig count for jackup and floating rigs for week 10 as of Monday 4th March, 2024

Week 10 2024 Jackups
Week 10 2024 Floaters

The global jackup count closed off the month at 409 units, which is flat compared with the end of January. Among the major areas tracked, the North Sea, Middle East and North America all declined by one rig each while other areas of the world contributed an even increase of three units. For floating rigs, the count at the end of February fell by six units, finishing at 149 units under contract or committed for work, compared with the end of January 2024. Asia Pacific and Africa recorded a two-rig decline with other areas contributing a further six-rig decline. However, South and North America each increased by two rigs during the period offsetting some of this market softness.

Global Rig Count As of DateGlobal Jackup Rig Count TotalGlobal Floating Rig Count Total
Monday 5th February409152
Monday 12th February408151
Monday 19th February410152
Monday 26th February409150

The global offshore rig count for jackup and floating rigs for week 9 as of Monday 26th February, 2024

Week 9 2024 Jackups
Week 9 2024 Floaters

The global offshore rig count for jackup and floating rigs for week 8 as of Monday 19th February, 2024

Week 8 2024 Jackups
Week 8 2024 Floaters

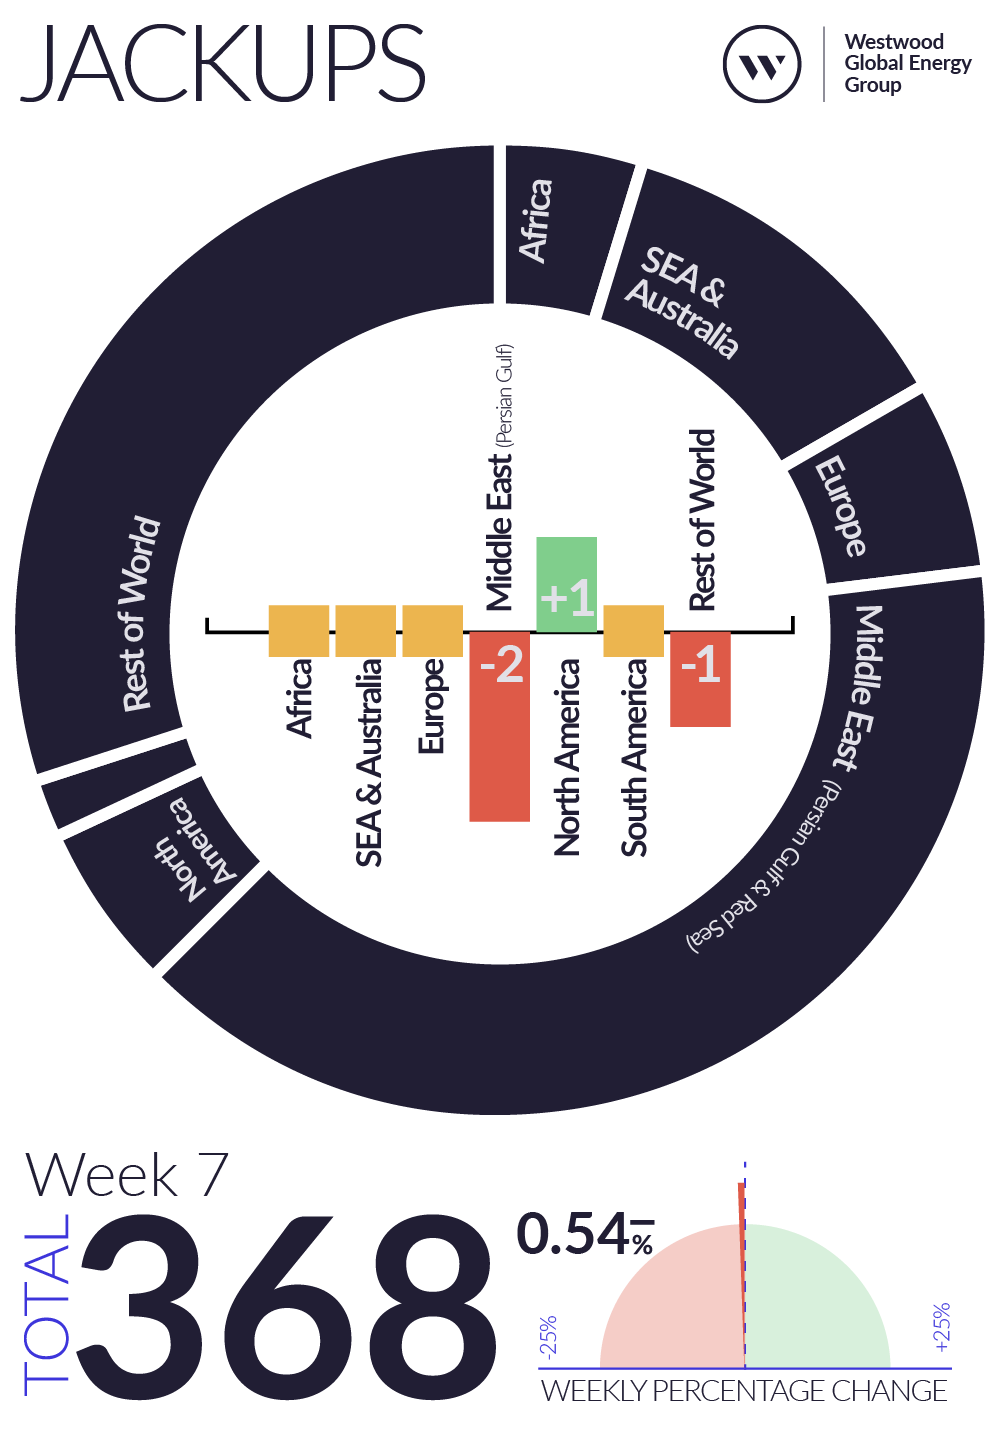
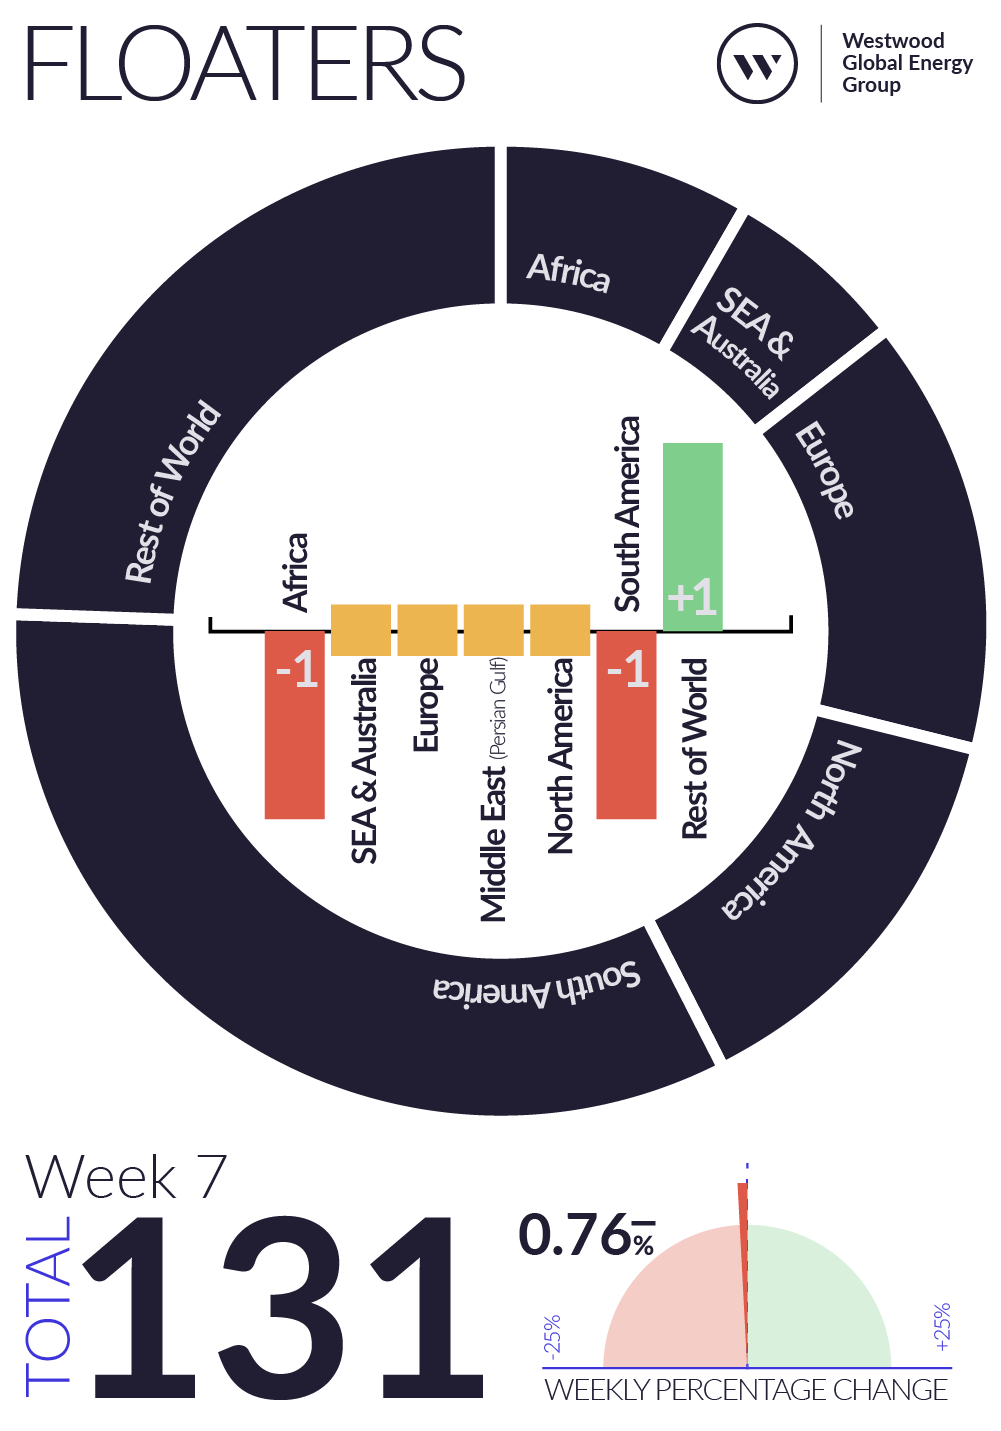
The global offshore rig count for jackup and floating rigs for week 7 as of Monday 12th February, 2024

Week 7 2024 Jackups
Week 7 2024 Floaters

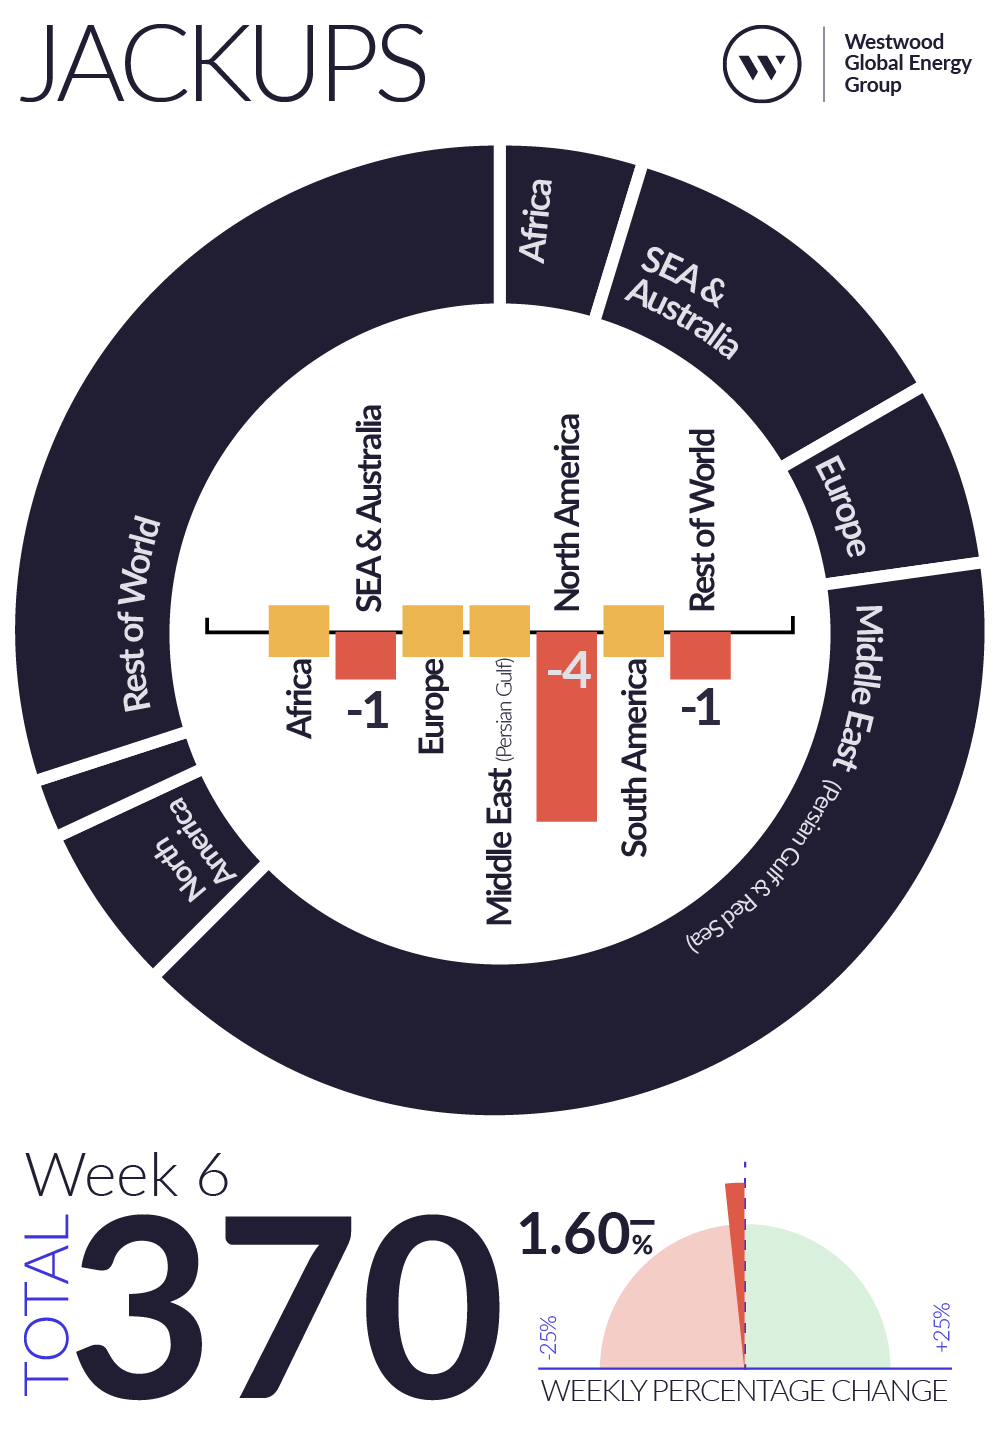
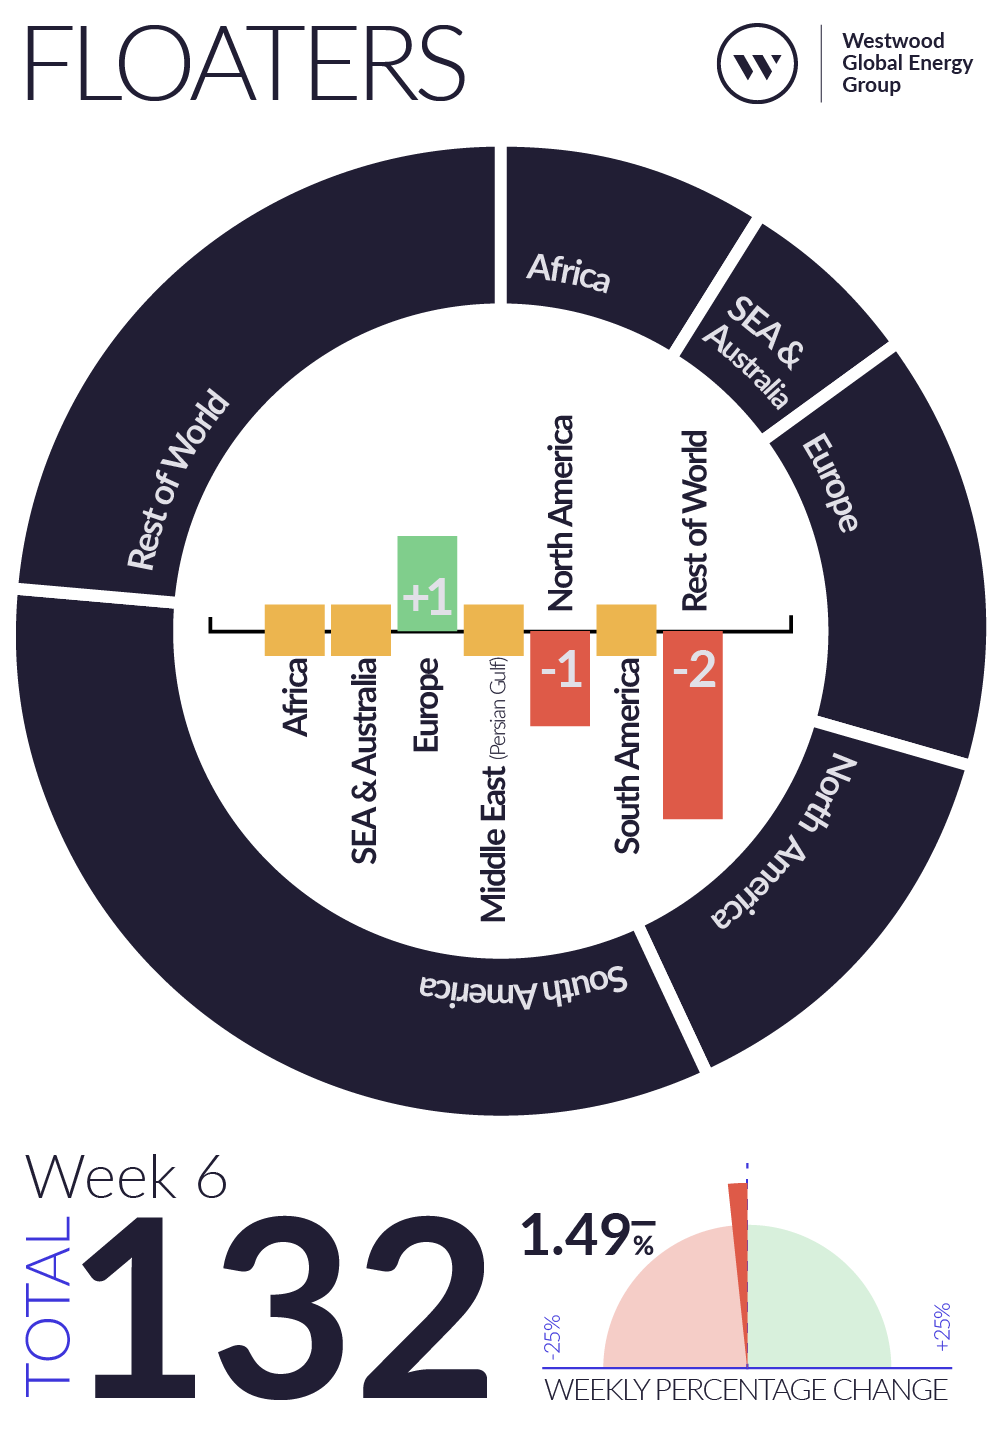
The global offshore rig count for jackup and floating rigs for week 6 as of Monday 5th February, 2024

Week 6 2023 Jackups
Week 6 2023 Floaters

The global jackup count in January rose by one unit, ending the month at 409. There are currently 31 jackup requirements at a tender or pre-tender stage, with a start date in the next six months, equating to an approximate potential backlog of 47 years of work. For floating rigs, the rig count in January fell by two units (versus the December 2023 total for the month), finishing at 152 units under contract. Southeast Asia and the North Sea each recorded declines, while West Africa increased by one unit. There are currently just six outstanding floater requirements at a tender or pre-tender stage, with a start date in the next six months, equating to an approximate potential backlog of 2.5 years of work.

Global Rig Count As of DateGlobal Jackup Rig Count TotalGlobal Floating Rig Count Total
Monday 8th January408150
Monday 15th January411151
Monday 22nd January409151
Monday 29th January409155

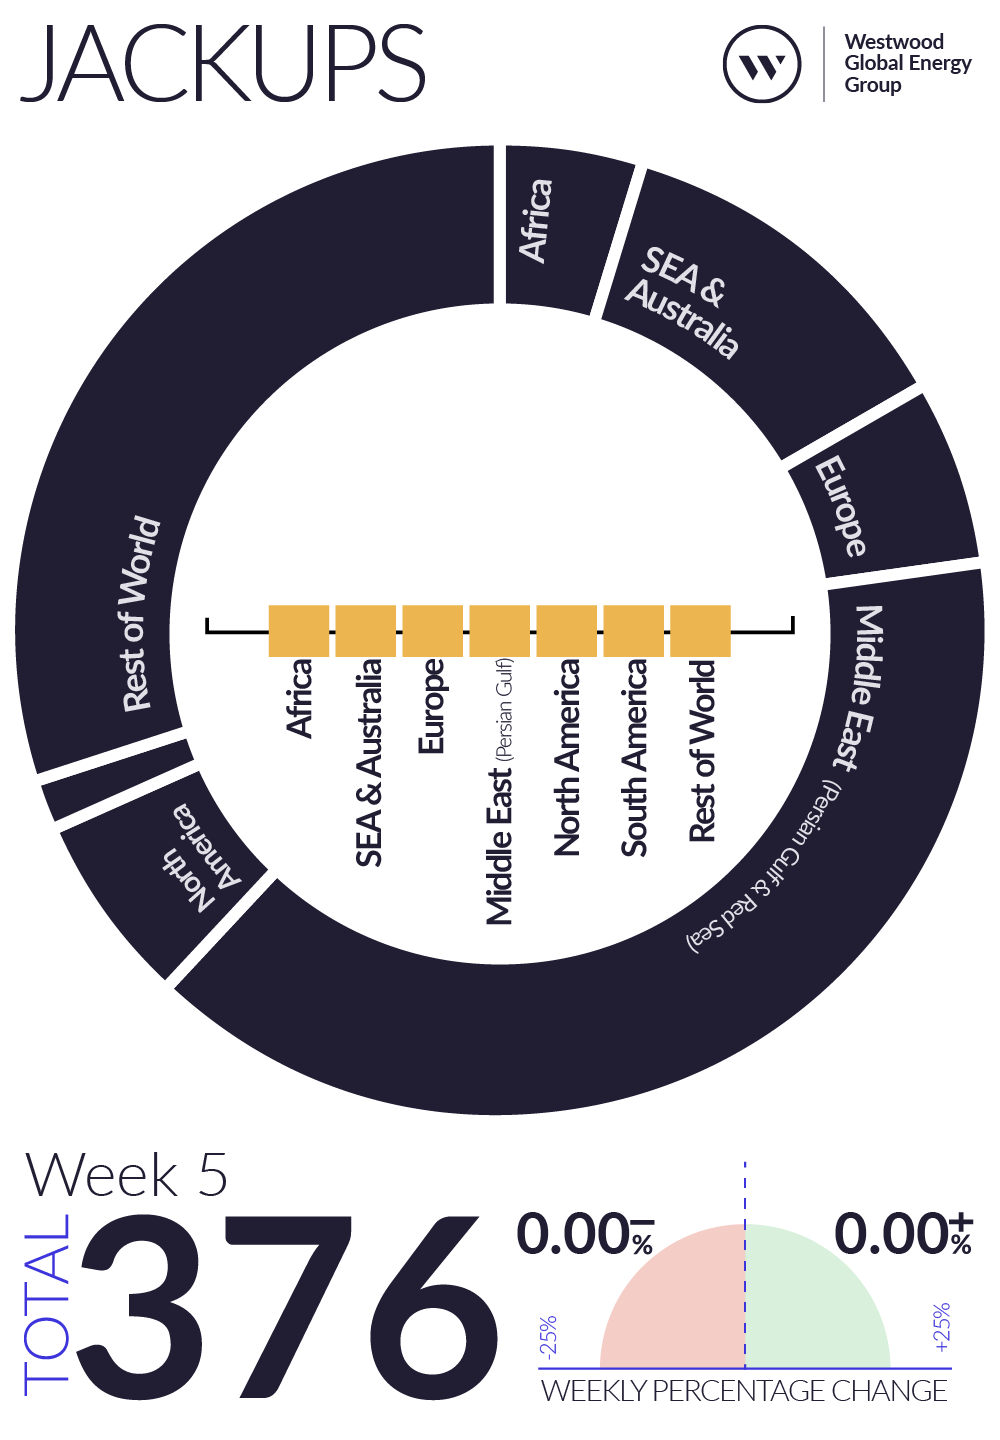
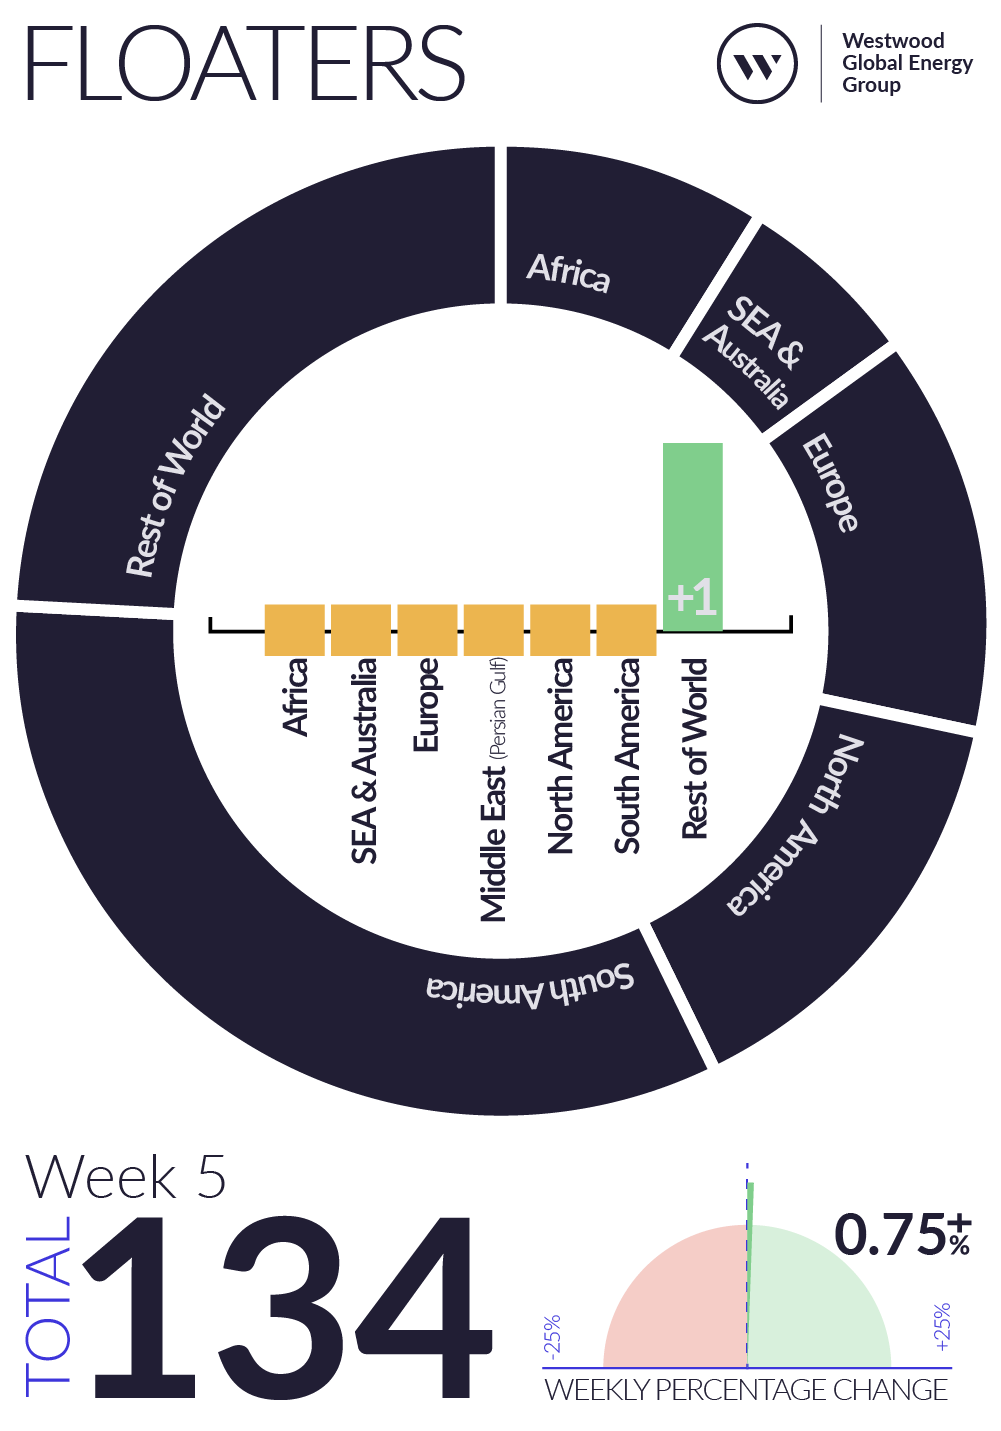
The global offshore rig count for jackup and floating rigs for week 5 as of Monday 29th January, 2024

Week 5 2024 Jackups
Week 5 2024 Floaters

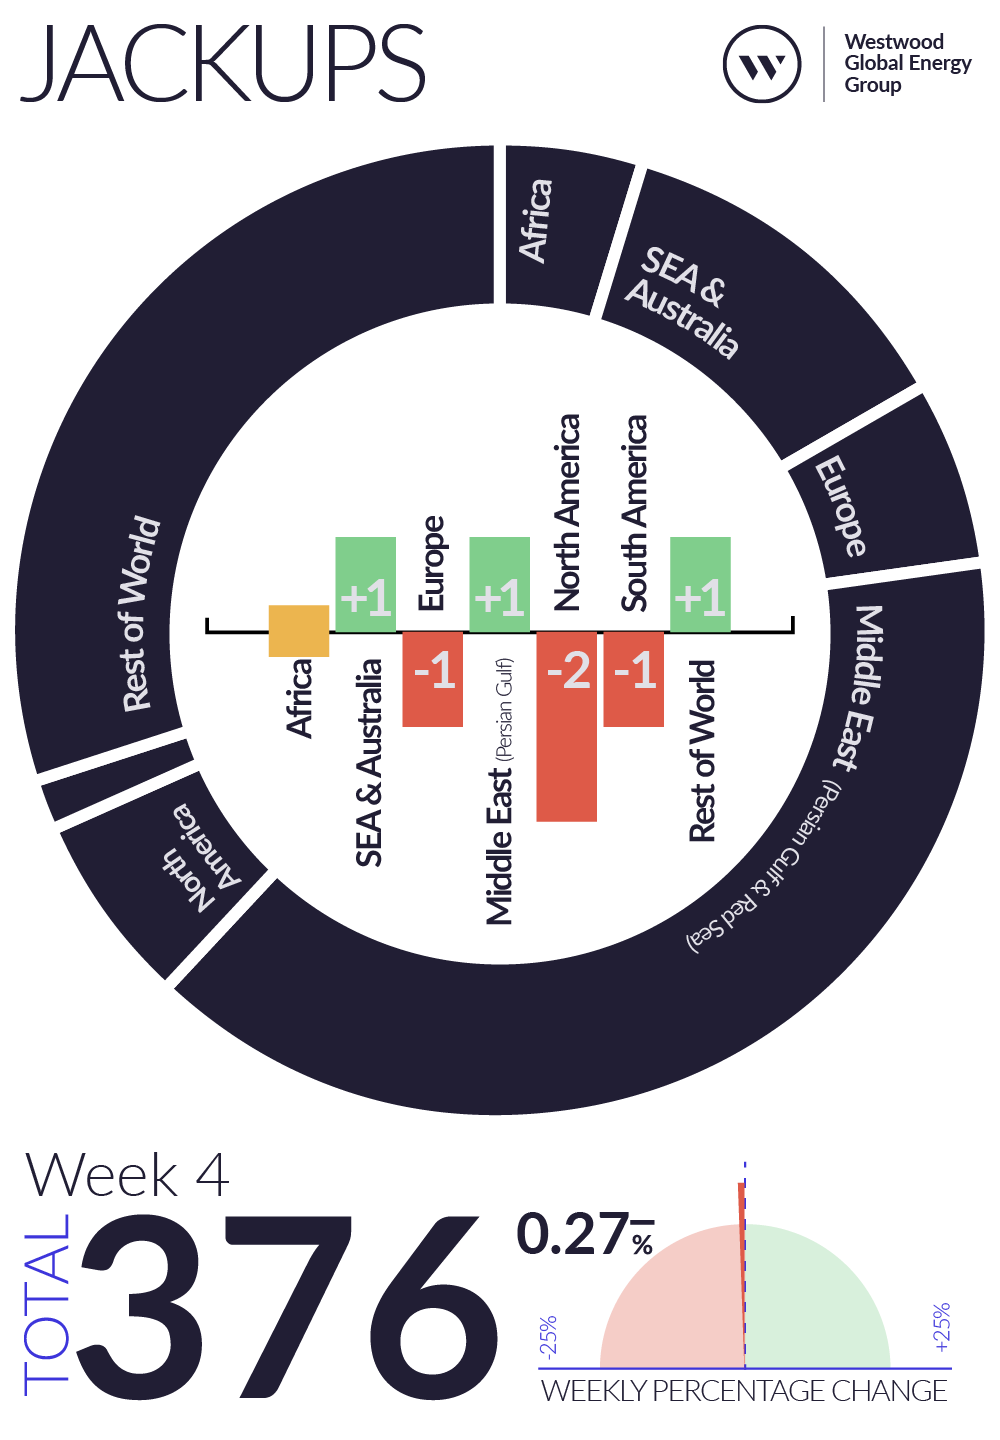
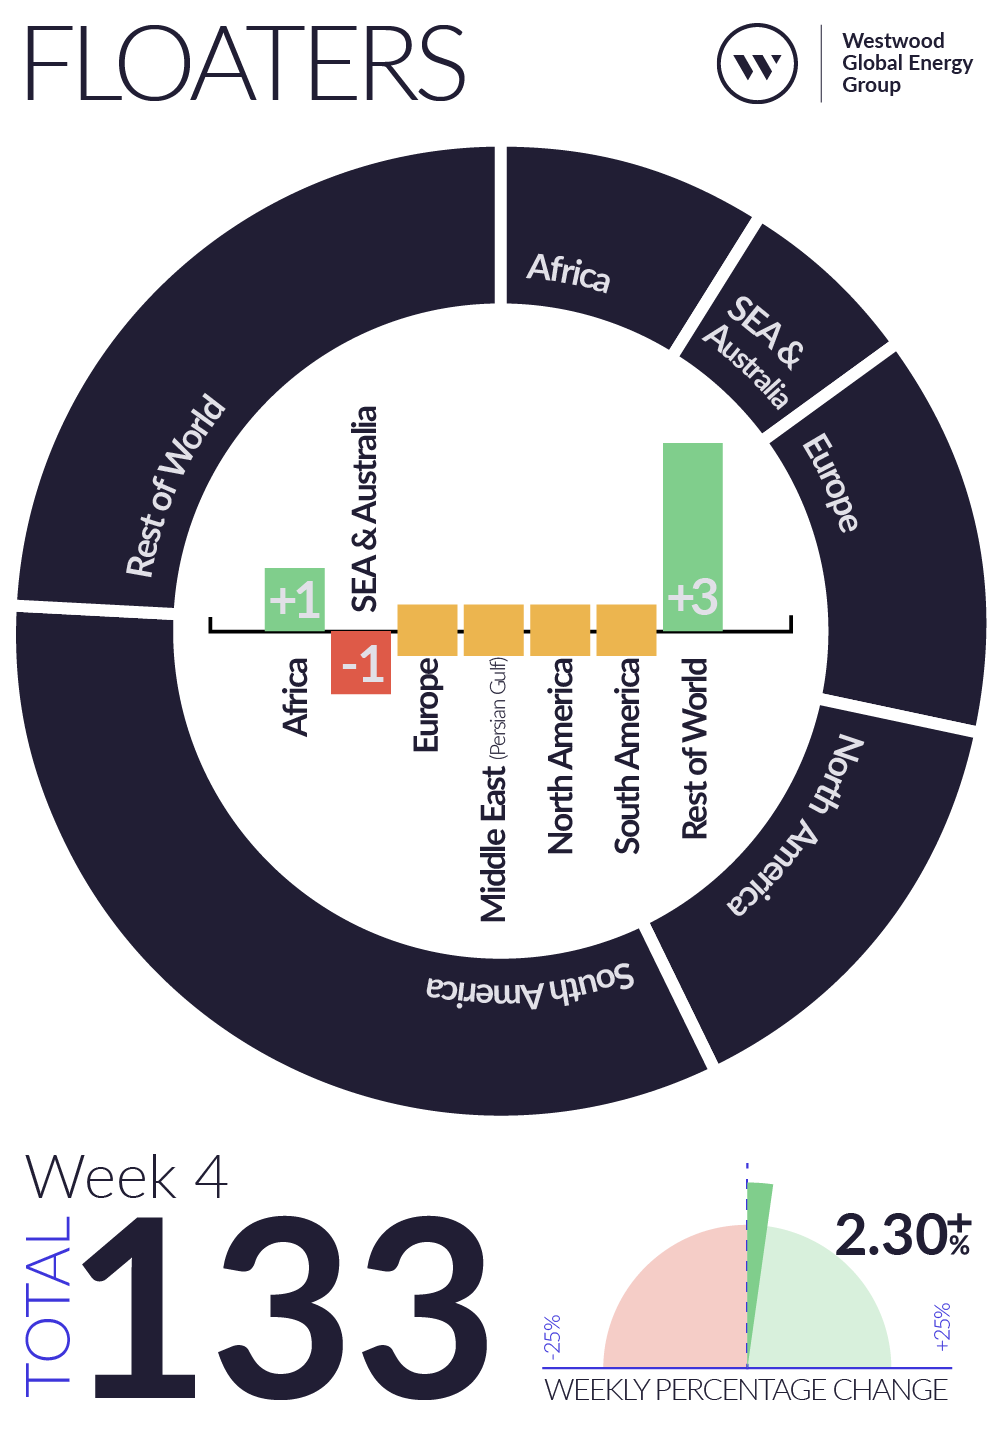
The global offshore rig count for jackup and floating rigs for week 4 as of Monday 22nd January, 2024

Week 4 2023 Jackups
Week 4 2023 Floaters

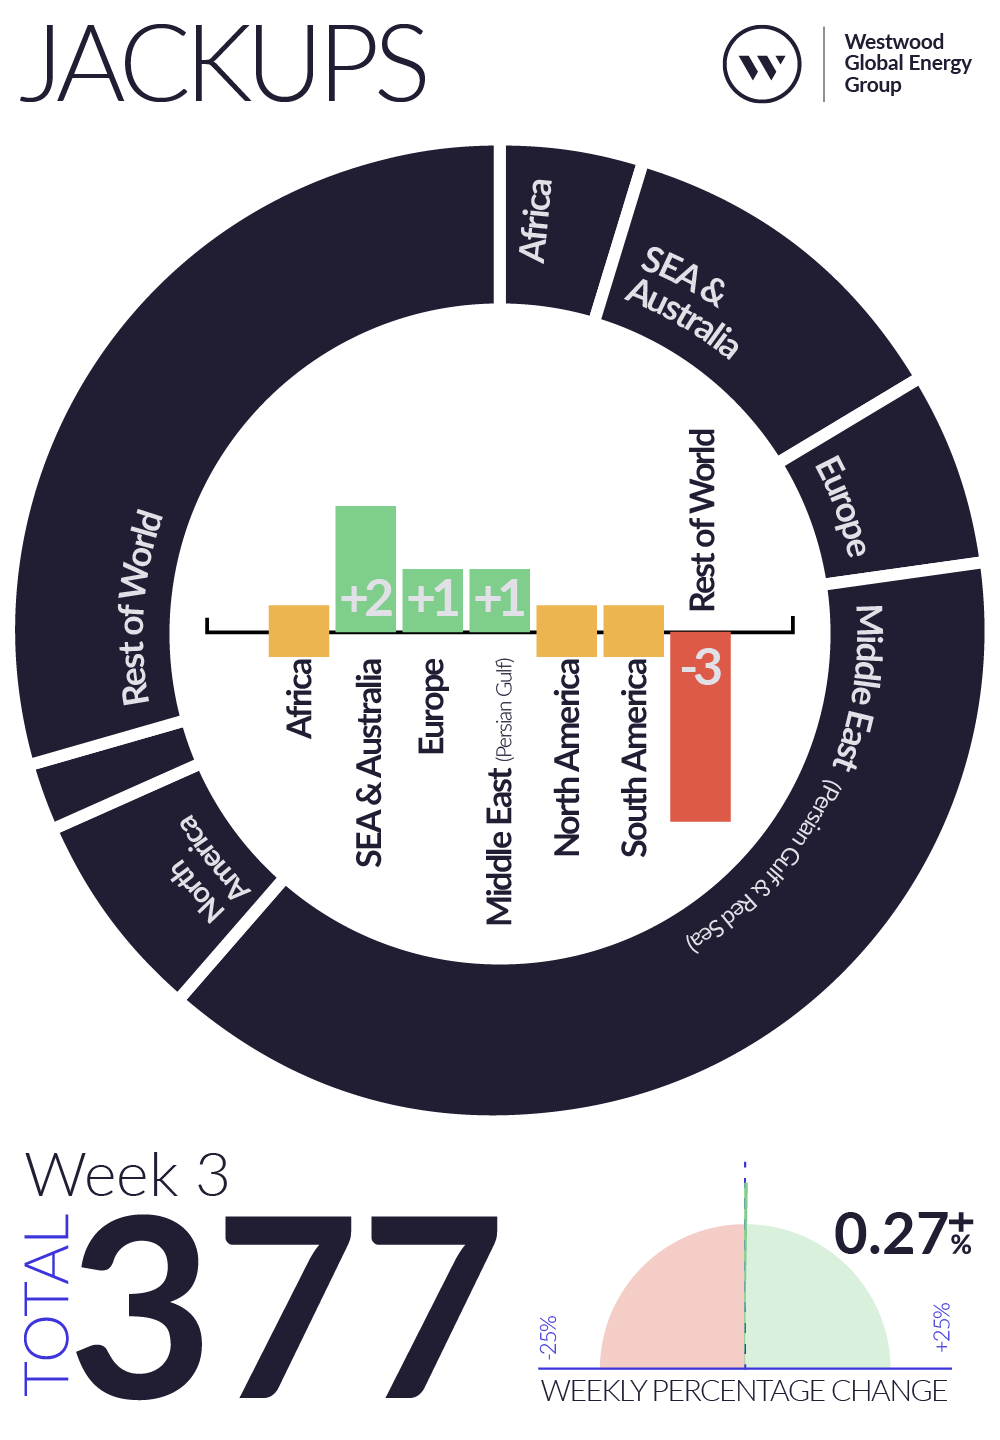
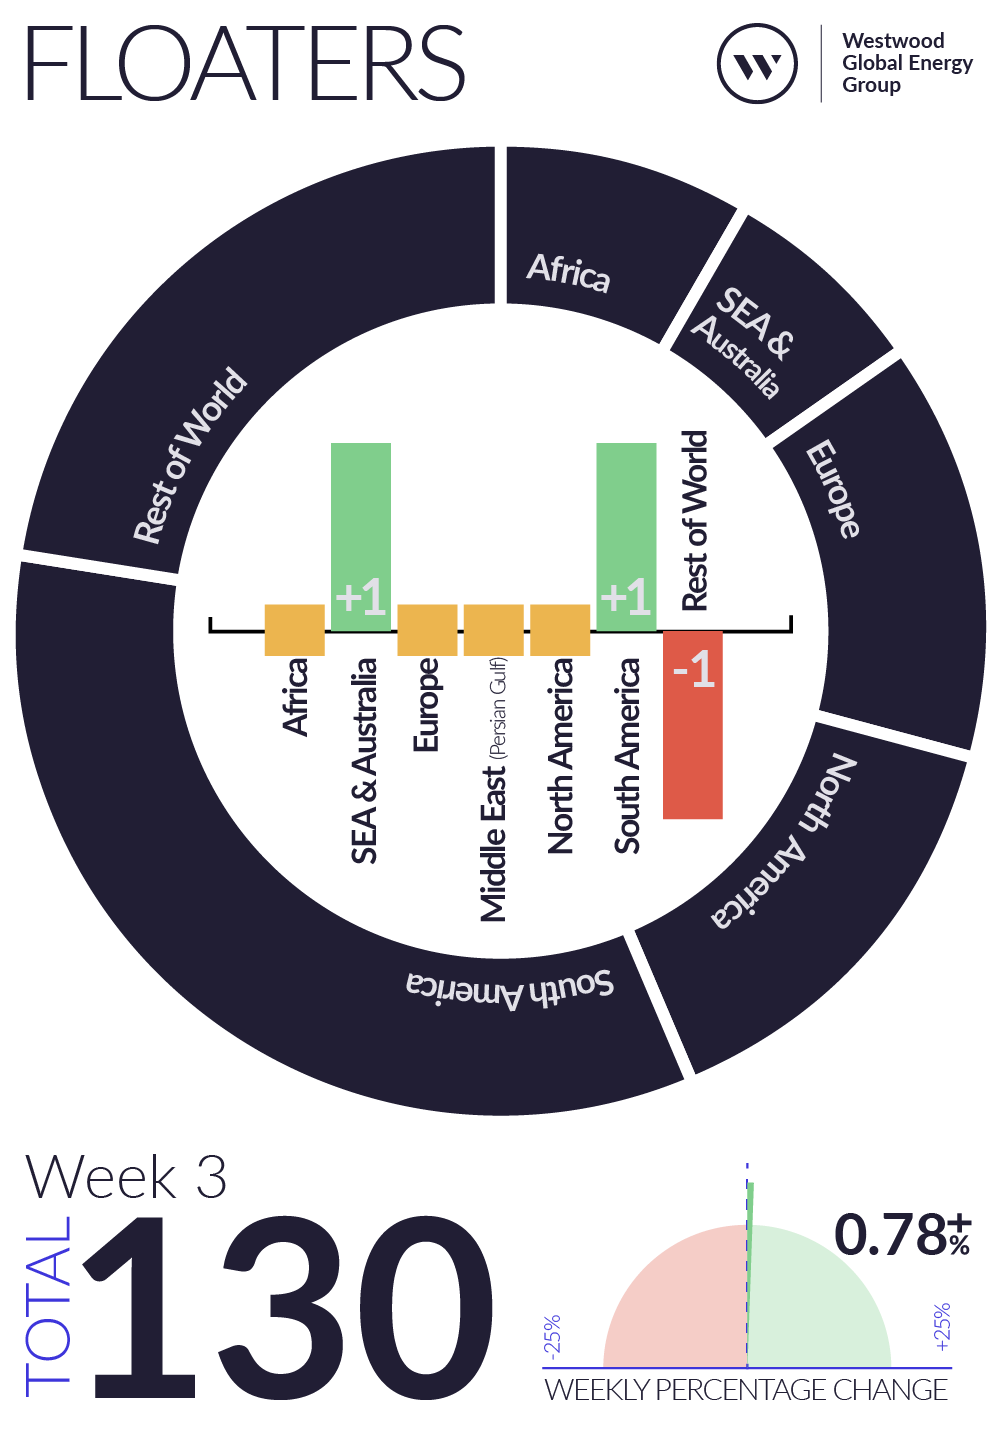
The global offshore rig count for jackup and floating rigs for week 3 as of Monday 15th January, 2024

Week 3 2023 Jackups
Week 3 2023 Floaters

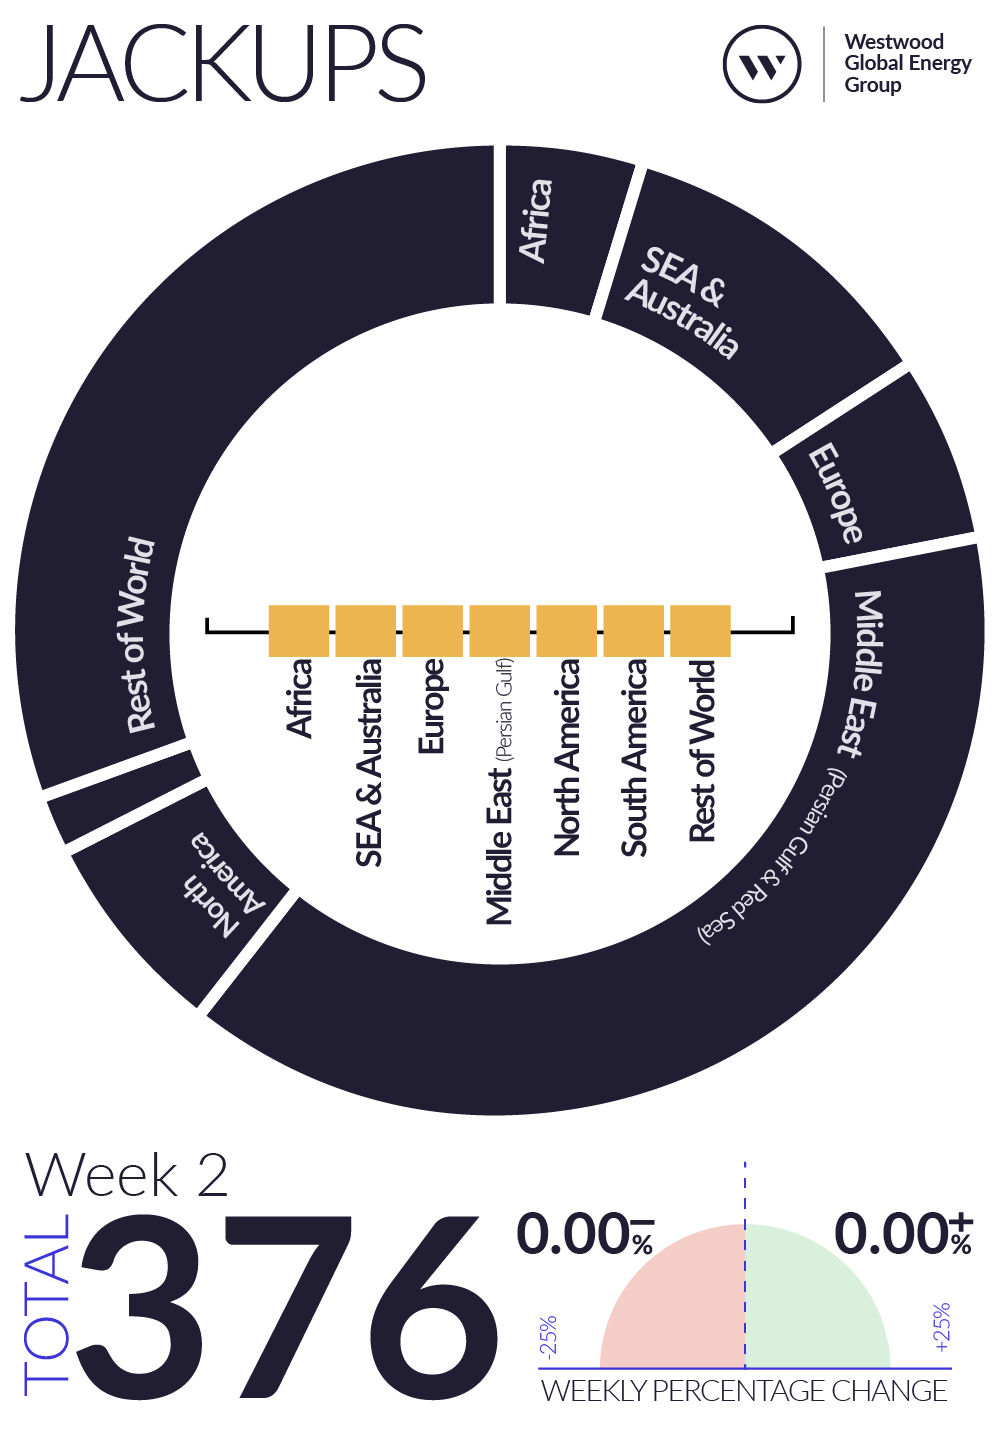
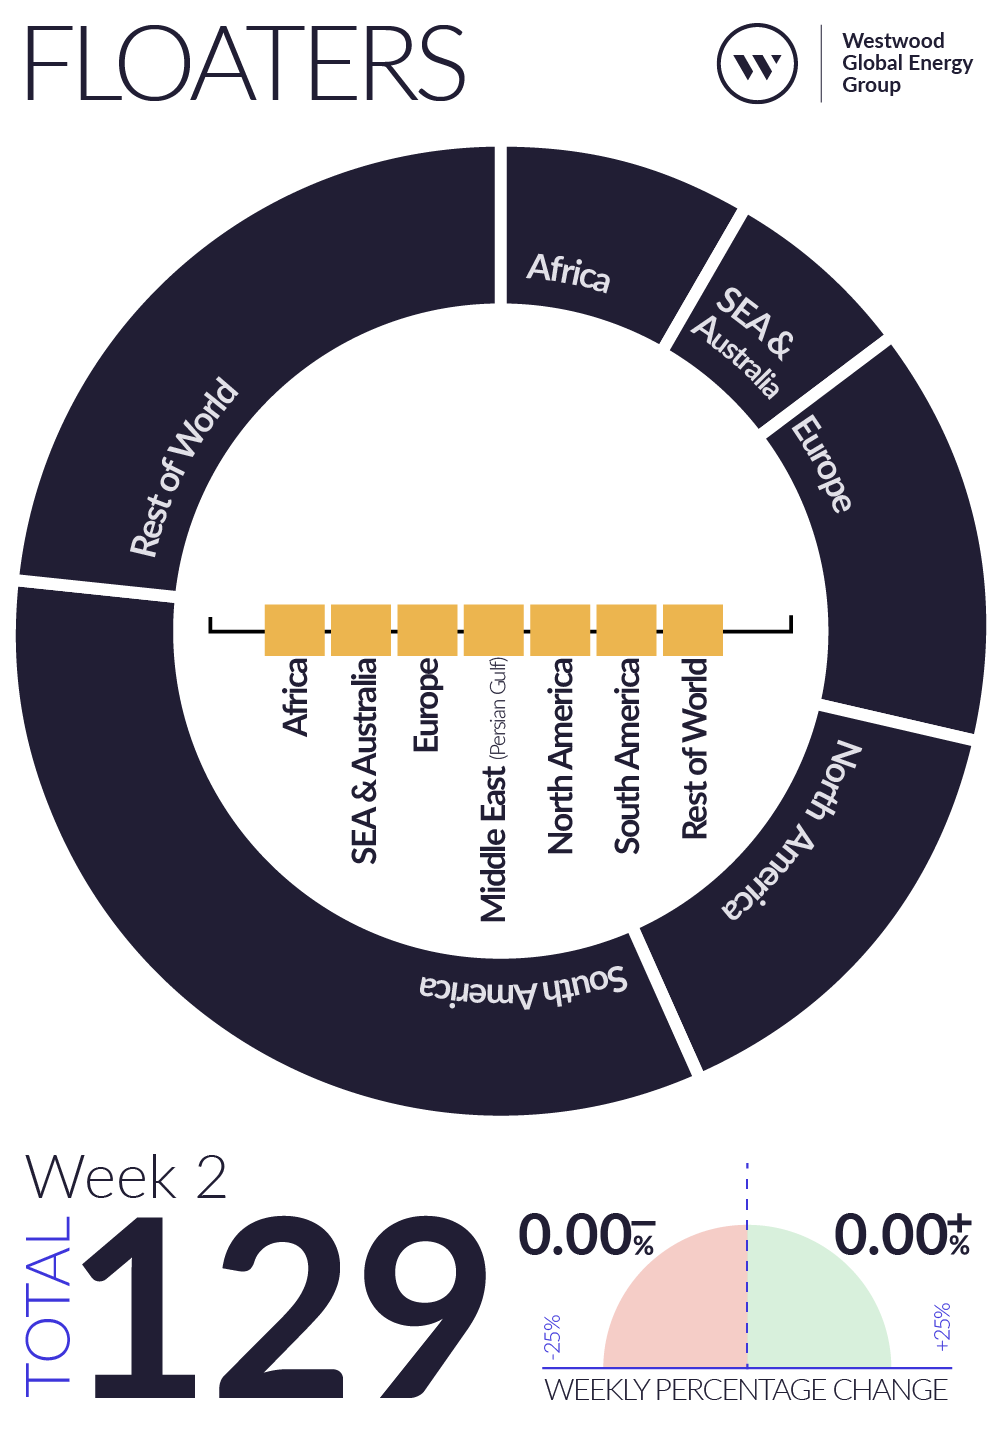
The global offshore rig count for jackup and floating rigs for week 2 as of Monday 8th January, 2024

Week 2 2024 Jackups
Week 2 2024 Floaters