The five supermajor oil companies have become incredibly efficient in generating cash from oil and gas production, enabling record payouts to shareholders. But why is capital investment lagging?
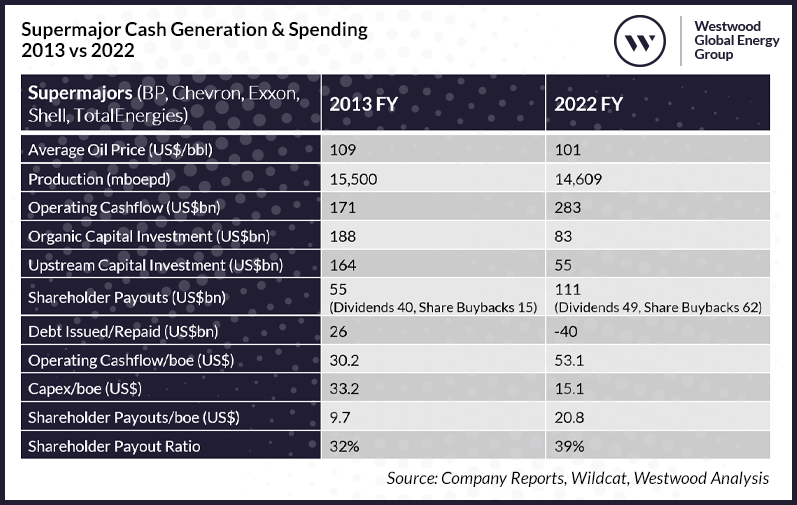
Supermajor Cash Generation & Spending 2013 vs 2022
The table compares cash generation and spending in 2022, when oil prices averaged $101/bbl with 2013, the last year when oil prices averaged over $100/bbl.
Source: Company Reports, Wildcat, Westwood Analysis
Production fell by around 900 mboe/d between 2013 and 2022, mainly due to a combination of the forced exit from Russia and divestments of higher cost production, yet operating cashflow increased from US$171bn in 2013 to US$283bn in 2022. That is an increase from $30 to $53 for every barrel produced, on an oil price 7% lower.
How has this transformation in cash generation capability happened? It is a combination of factors – lower operating costs through divestment of higher cost assets, increased operational uptime and efficiency, relatively higher natural gas prices, bigger oil and gas trading operations, lower supply chain costs, and slimmed down organisations.
In 2013 it was all about growth, with US$1.1 invested for every US$1.0 generated from operations. US$40bn in cash dividends and US$15bn of share buybacks had to be covered by $26bn of new borrowing. Oil companies were fat and happy, but it couldn’t last. The oil price crashed in late 2014, exposing the overspend in the dash for growth in the 2010-14 period and massive capital impairments and headline losses followed. Boards shied away from growth to focus on returns.
Fast forward to 2022 and the war in Ukraine combined with a rebound in oil and gas demand following the covid pandemic set the scene for booming oil and gas prices and incredible cash generation by the now leaner and more efficient oil companies.
All well and good, but what did the supermajors do with the US$283bn in cash they generated in 2022? Total organic capital investment was US$83bn in 2022, US$18bn (27%) higher than in 2021, but still below pre-covid pandemic levels and over US$100bn less than the US$188bn invested in 2013. Only 29 cents in every dollar of operating cash inflow was reinvested and only 19 cents of this was in the upstream. Lower supply chain costs mean less capital is needed to sustain production than in 2013, but nonetheless, there is clearly the financial capacity to spend more if companies choose to do so.
Meanwhile US$111bn was spent on shareholder payouts with US$49bn going on dividends and US$62bn on share buybacks. Cash dividends were only US$9bn more than in 2013 but share buybacks increased by US$47bn. In addition, US$40bn in debt was repaid. Total shareholder returns for the supermajors in 2022 averaged 48%, 5% from cash dividends and 43% from increased share prices.
The modest capital investment levels compared to shareholder distributions has attracted political attention at a time of high inflation when governments in Europe are having to subsidise energy bills. The clamour for windfall taxes to capture the exceptional profits has proved hard to resist.
So why is capital investment lagging? Firstly, companies are promising to focus on value over volume through to 2030, with the emphasis on low cost, lower emissions production with strong cash generation and generous shareholder distributions. Capital discipline is promised with upstream projects robust to downside price scenarios. For example, Exxon says 90% of its capex will be in projects that deliver >10% returns at less than or equal to US$35/bbl. For LNG it is >10% returns at US$6/mmbtu. TotalEnergies is targeting projects with <US$30/bbl after tax breakeven, or <US$20/boe combined capex and opex. Only BP is committed to cutting oil and gas production by 2030, though it has recently raised its production target to 2 million boepd in 2030 from 1.5 million boepd previously.
There are also opportunity constraints with asset portfolios having shrunk and only modest exploration success in the last few years meaning a limit to the upstream development options that meet these strict criteria. Finally, new oil and gas project sanctions have been met with vocal ‘no new oil and gas is needed’ protests and legal challenges designed to discourage investment.
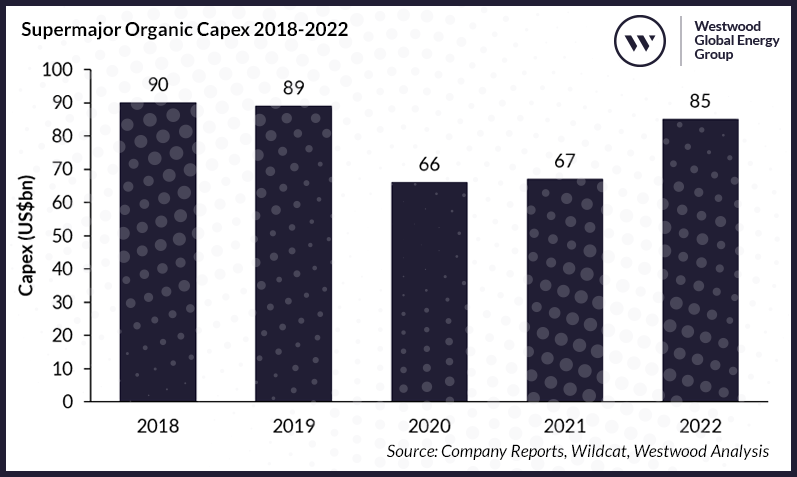
Supermajor Organic Capex 2018-2022
Source: Company Reports, Wildcat, Westwood Analysis
Spending on Energy Transition related projects is ramping up but it is still relatively modest compared to conventional hydrocarbons. BP reported the rates of return expected from their renewables power portfolio to be typically 6-8%, hardly attractive when returns on capital employed for the majors are now over 20%, with upstream doing even better than that.
All five companies are guiding that capital investment levels are going to hold roughly at current levels through to 2030. They argue that continued capital discipline is what is going to drive exceptional cash generation and shareholder returns. Why change a winning formula when long term hydrocarbon demand is so uncertain?
Meanwhile the public discourse includes calls for both higher short-term oil and gas production and more aggressive investments in renewables to calm prices. It is a combination of continued demand growth for oil and gas and lower investment, which has driven prices higher. Oil companies can say very reasonably that they do not set oil and gas prices; the supermajors together account for only 8% of global oil and 10% of global gas production.
Big oil is not going to open the capital investment taps – it is not in their interests to do so. Unless it can tame demand to bring prices down, Society will need to decide what do about the excess upstream cash generation. No doubt the debate about windfall taxes will continue.
Keith Myers, Senior Associate
[email protected]