
Summary
Westwood’s analysis of 3 E&P peer groups – the five Supermajors, four selected National Oil Companies (“NOCs”) – Saudi Aramco, Petrobras, Rosneft and Sinopec and 17 selected US Shale producers suggests that 2021 capital expenditures are likely to remain relatively flat or decrease slightly compared to 2020, at a US$50/bbl Brent (US$45/bbl WTI) oil price assumption.
- The Supermajor peer group reinvested 88% of operating cashflow (“OCF”) into capital expenditures during Q1-Q3 2020 when Brent averaged US$41/bbl, the highest ratio of all assessed peer groups. 2021 guidance indicates that the Supermajors intend to cut capital expenditures by a collective c.US$10bn and Westwood estimates that an oil price of US$48/bbl is needed in 2021 for OCF to cover both capex and dividends for this peer group.
- The NOC peer group is likely to maintain or slightly reduce capital expenditures, driven by capital discipline from Saudi Aramco, a focus on deleveraging from Petrobras, and a tightening of investment criteria from Rosneft. However, the NOC group is less leveraged relative to the Supermajors & US Shale producers and has capacity (Saudi Aramco especially), to access debt markets as required.
- The US shale peer group was the least burdened by shareholder pay-outs and managed to be self funding in 2020, but several companies are still very highly leveraged and servicing debt is likely to be the overriding consideration in 2021.
- Capital expenditure could rise if the WTI price increases to above US$45/bbl, but is likely to be focussed on premium acreage to maximise payback.
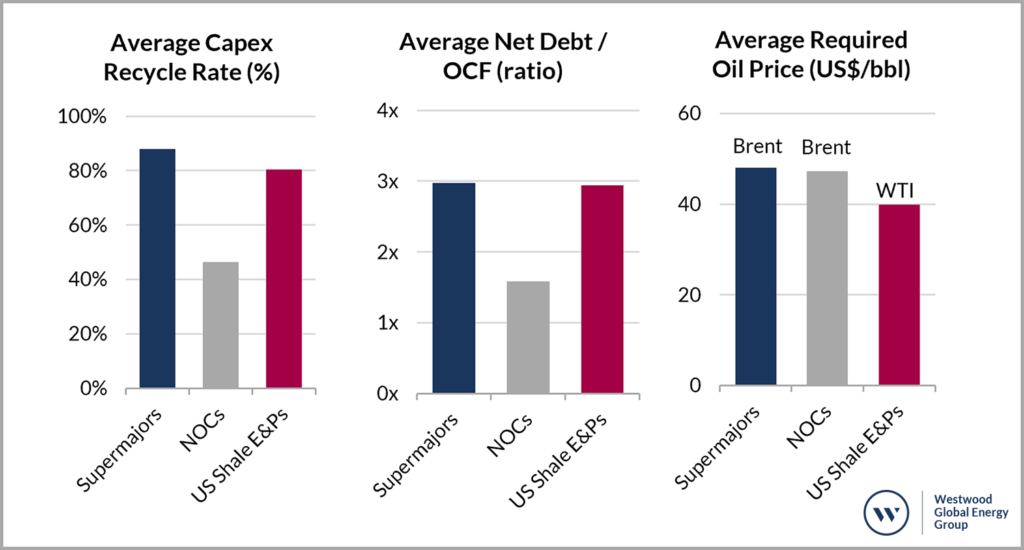
Figure 1. Comparison of average capex recycle rate (capital expenditure as a percentage of operating cashflow), average net debt/operating cashflow (based on annualised Q1-Q3 2020 OCF, excluding outliers), and the average oil price needed for 2021 capital expenditures and shareholder pay-outs to be funded from OCF for the Supermajors, select National Oil Companies & select US Shale E&P companies. Supermajors & NOC analysis based on Brent price, US shale analysis based on WTI price.
Source: company reports & Westwood analysis.
Introduction
2020 has been a tumultuous year for the E&P sector, with companies reacting to lower commodity prices by slashing capital expenditure and in some cases cutting shareholder pay-outs. Despite these actions, E&P companies have still needed to issue significant amounts of debt to cover their cash outgoings; clearly this business model is unsustainable. As 2020 draws to a close, this Westwood Insight looks at the outlook for 2021 upstream capital expenditures for three E&P company peer groups – the Supermajors, selected listed National Oil Companies and US Shale producers.
Cash flow in the first nine months of 2020 when Brent averaged US$41/bbl has been analysed and the required commodity prices for operating cashflows to cover capital expenditures and shareholder pay-outs in 2021 have been modelled. The cashflow modelling together with debt leverage ratios (based on Q3 reported debt and annualised Q1-Q3 2020 OCF) and company guidance forms the backdrop to whether E&P companies are likely to increase, decrease or maintain 2020 capital expenditure levels.
2020 Overview & 2021 Outlook
Supermajors
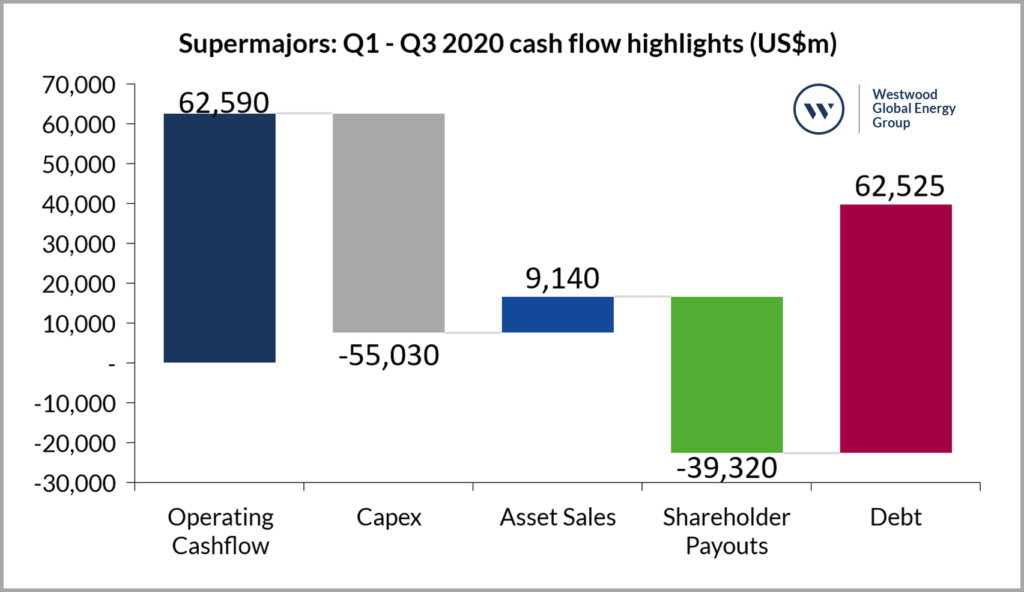
Figure 2. Selected cashflow categories from Q3 reports for Supermajors (Shell, BP, ExxonMobil, Chevron, Total). Does not represent the complete change in cash over the period. Based on Brent prices.
Source: Q3 financial reports and Westwood analysis.
Over Q1-Q3 2020 the Brent oil price averaged US$41/bbl and the Supermajors collectively generated US$62.6bn in OCF and reinvested c.US$55bn (88%) in capital expenditures, with asset sales bringing in c.US$9.1bn in cash. Meanwhile, shareholder pay-outs in the form of dividends and share buy backs totalled US$39.3bn and companies raised a massive US$62.5bn in cash from new debt issuances (net of repayments).
BP and ExxonMobil reported that capital expenditures alone exceeded OCF in the first 9 months of 2020, with recycle rates of c.117% and 134% respectively. Chevron’s US$7.8bn in shareholder pay-outs exceeded OCF by US$450m. This cash outflow was funded through new debt issuance but is clearly unsustainable longer term without an oil price recovery.
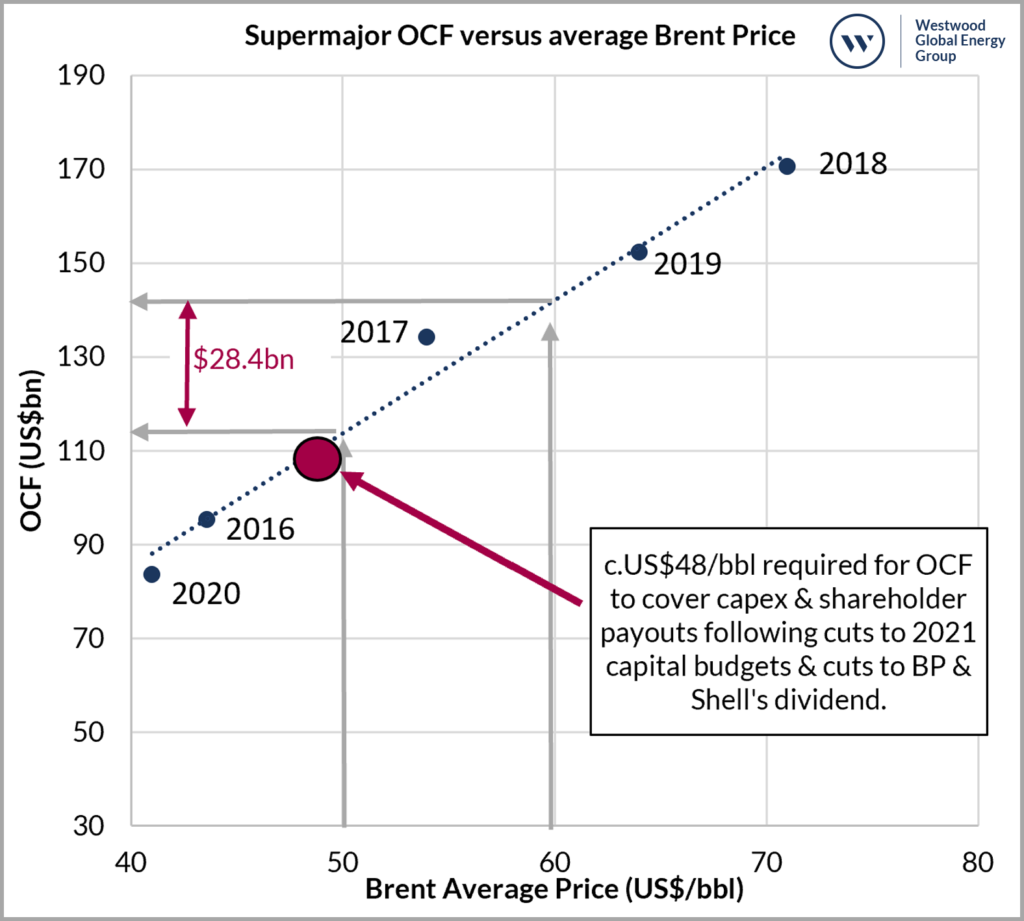
Figure 3. Impact of Brent Oil Price on Operational Cash Flows for the Supermajors over 2016-2020 (2020 annualised from Q1-Q3 numbers).
Source: Company Reports & Westwood Analysis.
The Supermajors have started to announce guidance for 2021 capital budgets. ExxonMobil has signalled that it will cut capex to as low as US$16bn in 2021 from US$23bn for 2020 (itself a downward revision from an original budget of US$33bn). In addition, Chevron has provided 2021 capital guidance of US$14bn and reduced its longer-term guidance to US$14-$16bn annually to 2025, down from previous guidance for the same period of US$19-$22bn (which excluded Noble Energy). Total has also announced a US$1bn capex reduction for 2021 (from US$13bn in 2020). Cuts are not ubiquitous, however, with BP suggesting that 2021 capex will be in the lower end of a US$13-15bn range, relative to FY2020 expectations of US$12bn. Collectively, the Supermajor group has announced capex cuts of c.US$10bn for 2021 (relative to 2020). This saving, alongside cuts to BP & Shell’s dividend reduces the oil price required for OCF to cover capital expenditures and shareholder pay-outs in 2021 to c.US$48/bbl.
Select National Oil Companies
The listed NOC peer group of Saudi Aramco, Petrobras, Rosneft and Sinopec also found a US$40/bbl Brent price challenging, with collective capital expenditures and shareholder pay-outs exceeding OCF by US$6.9bn during Q1-Q3 2020. The NOC peer group spent US$44.6bn in capital expenditure in the first 9 months of 2020 equating to c.46% of OCF, with shareholder pay-outs accounting for a further c.62% of OCF.
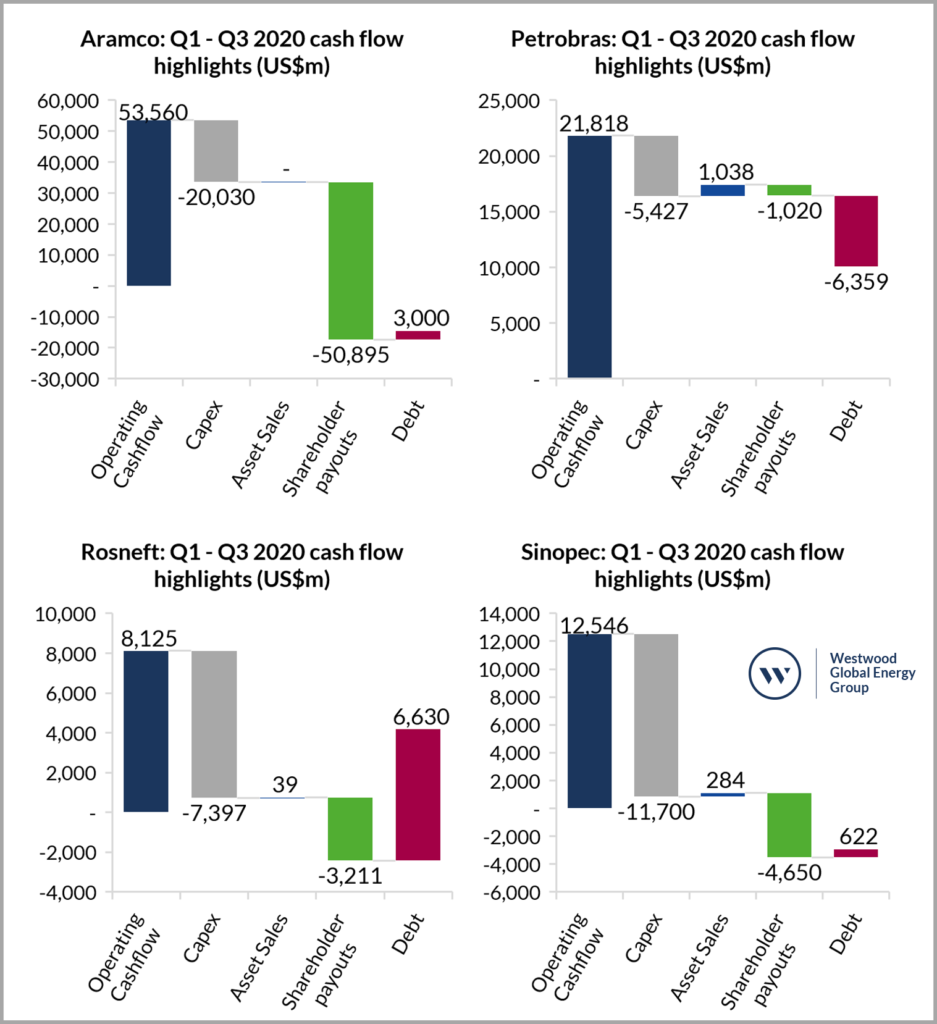
Figure 4. Selected cashflow categories from Q3 reports for select National Oil Companies (Saudi Aramco, Petrobras, Rosneft & Sinopec). Does not represent the complete change in cash over the period. Saudi Aramco figures exclude cash acquired in Sabic acquisition and sale of short-term securities. Based on Brent prices.
Source Q3 financial reports and Westwood analysis.
NOC capital expenditures and shareholder pay-outs accounted for c.108% of OCF in Q1-Q3 2020 (necessitating some debt raising), but it was lower than the Supermajors who spent c.151% of OCF on capex and shareholder pay-outs. There are, however, significant differences between NOCs with Sinopec & Rosneft both recycling >90% of OCF into capital expenditures, while Saudi Aramco and Petrobras recycled only 37% and 25% of OCF into capital expenditures, respectively.
The NOC peer group may collectively appear better placed than the Supermajors to sustain or increase capital expenditures in 2021 but there are reasons to expect continued budget restraint. Petrobras, for example (the only assessed NOC to have a combined capex and shareholder pay-out rate of <100%), reported US$80bn of gross debt in its Q3 2020 filings, and continues to be committed to reducing debt to US$60bn in 2022. Petrobras’ recently revised strategic plan indicates c.US$47bn of E&P capex will be spent over 2021-2025, down from previous guidance of c.US$64bn with a focus on pre-salt field development.
Saudi Aramco spent c.US$50bn on shareholder pay-outs in the first 9 months of 2020 and c.US$20bn in capital expenditures. Should Aramco continue with these levels of capex and shareholder pay-outs, then an average 2021 Brent oil price of c.US$55/bbl is estimated to be needed at 2020 production levels for self-funding from OCF, or else further capital raising could be required. Saudi Aramco raised $8 billion in the debt markets in November. Saudi Aramco has indicated that it will exhibit capital restraint next year (with FY capex potentially as low as US$25bn). Rosneft and Sinopec would also require c.US$55/bbl in 2021, if capex and shareholder pay-outs were to be kept at 2020 levels; though neither firm has issued capital guidance for 2021. Petrobras would require a lower average oil price in 2021, by virtue of it having comparatively low capital expenditures and shareholder pay-outs, bringing the overall oil price requirement to c.US$48/bbl for the NOC peer group. In the case of Rosneft, debt has already increased by US$6.6bn over Q1-Q3 2020, and 2020 cashflows have been impacted by both low commodity prices and participation in OPEC+ production cuts. Rosneft has indicated that the required hurdle rate for projects has been raised. As a result, Rosneft may either maintain or slightly reduce capital expenditures from 2020 levels.
In summary, the NOCs analysed are unlikely to grow capital budgets into 2021, primarily driven by capital discipline from Saudi Aramco, a focus on deleveraging from Petrobras, and a tightening of investment criteria from Rosneft.
US Shale E&Ps
In aggregate, the 17 company US shale peer group generated US$19.4bn in operating cashflows and spent US$15.6bn in capital expenditures in Q1-Q3 2020, a recycle rate of c.80%. The US shale companies paid shareholders on average c.9% of the OCF generated or US$1.7bn over the same period. Three US shale companies (Pioneer Natural Resources, EOG Resources and Cabot Oil & Gas) paid more than 15% of OCF as shareholder pay-outs, accounting for c.60% of the total for the group. Of the 17 assessed US Shale companies, 10 reduced net debt during Q1-Q3 2020, showing that deleveraging has been the key priority for the group.
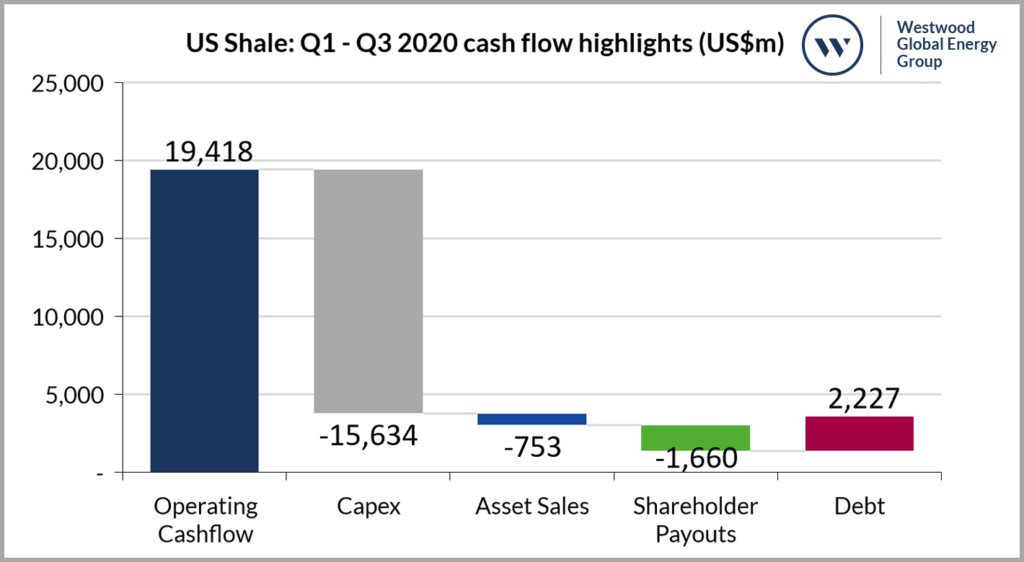
Figure 5. Selected cashflow categories from Q3 reports for select US Shale companies (17 public E&P companies with market cap exceeding US$1.5bn). Does not represent the complete change in cash over the period.
Source Q3 financial reports and Westwood analysis.
The US Shale peer group was able to respond quickly to falling commodity prices, cutting capex by US$17bn. Low capex and shareholder pay-outs has led the US shale peer group to be the only E&P group studied to have positive free cashflow after shareholder pay-outs at the end of Q3 2020, even after accounting for asset acquisitions that contributed to c.US$753m of cash outflow.
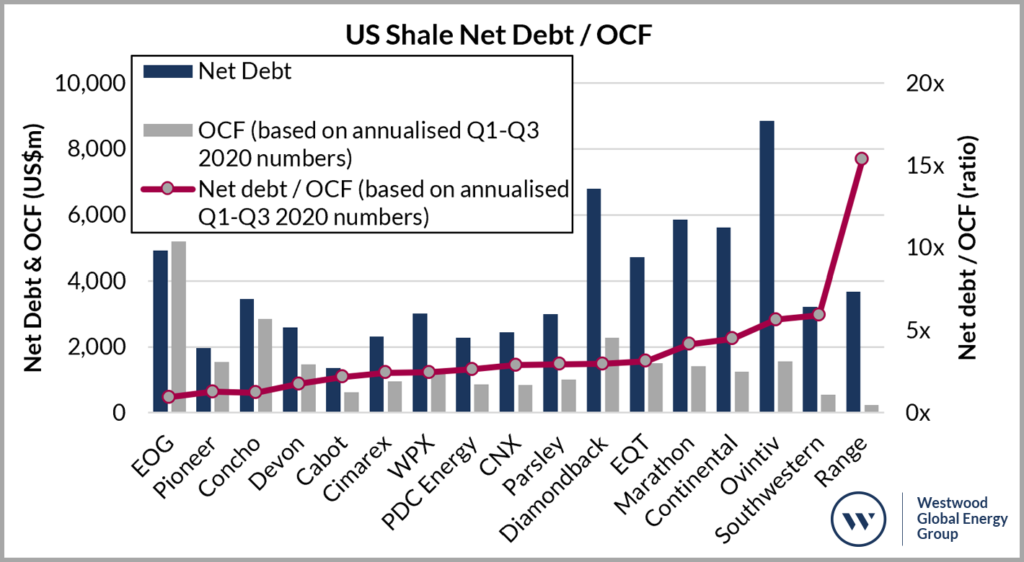
Figure 6. Net debt, OCF (based annualised Q1-Q3 2020 numbers & WTI prices) & net debt/OCF ratio (based on annualised Q1-Q3 2020 OCF) for select US Shale companies (17 public E&P companies with market cap exceeding US$1.5bn).
Source: Q3 financial reports and Westwood analysis.
For the US shale peer group to maintain 2020 levels of capital expenditures and shareholder pay-outs in 2021 (without raising debt), WTI oil prices would need to average c.US40/bbl assuming flat year on year production. At WTI prices of US$45/bbl, the US shale peer group would see a surplus of c.US$4bn over 2021. Despite this backdrop, significant growth in capital expenditures in 2021 seems unlikely without a significant increase in oil prices. The assessed US shale E&Ps collectively share c.US$66bn in debt, and access to debt markets remains challenging. As a result, US shale E&Ps are likely to continue prioritising allocation of surplus cash towards paying down debt & strengthening balance sheets throughout 2021. Some companies may be able to increase capital spending in line with further oil price recovery above US$45/bbl WTI, with a focus on premium acreage.
In conclusion, overall upstream capital investment in 2021 is likely to be flat or down slightly compared to 2020 levels, based on the companies analysed and a US$50/bbl Brent (US$45/bbl WTI) oil price assumption.
Peter Heath
[email protected]
Arindam Das
[email protected]
Keith Myers
[email protected]